29
/es/
es
AIzaSyAYiBZKx7MnpbEhh9jyipgxe19OcubqV5w
April 1, 2024
32664
Europe & Central Asia (IDA & IBRD countries)
TEC
false
2
1
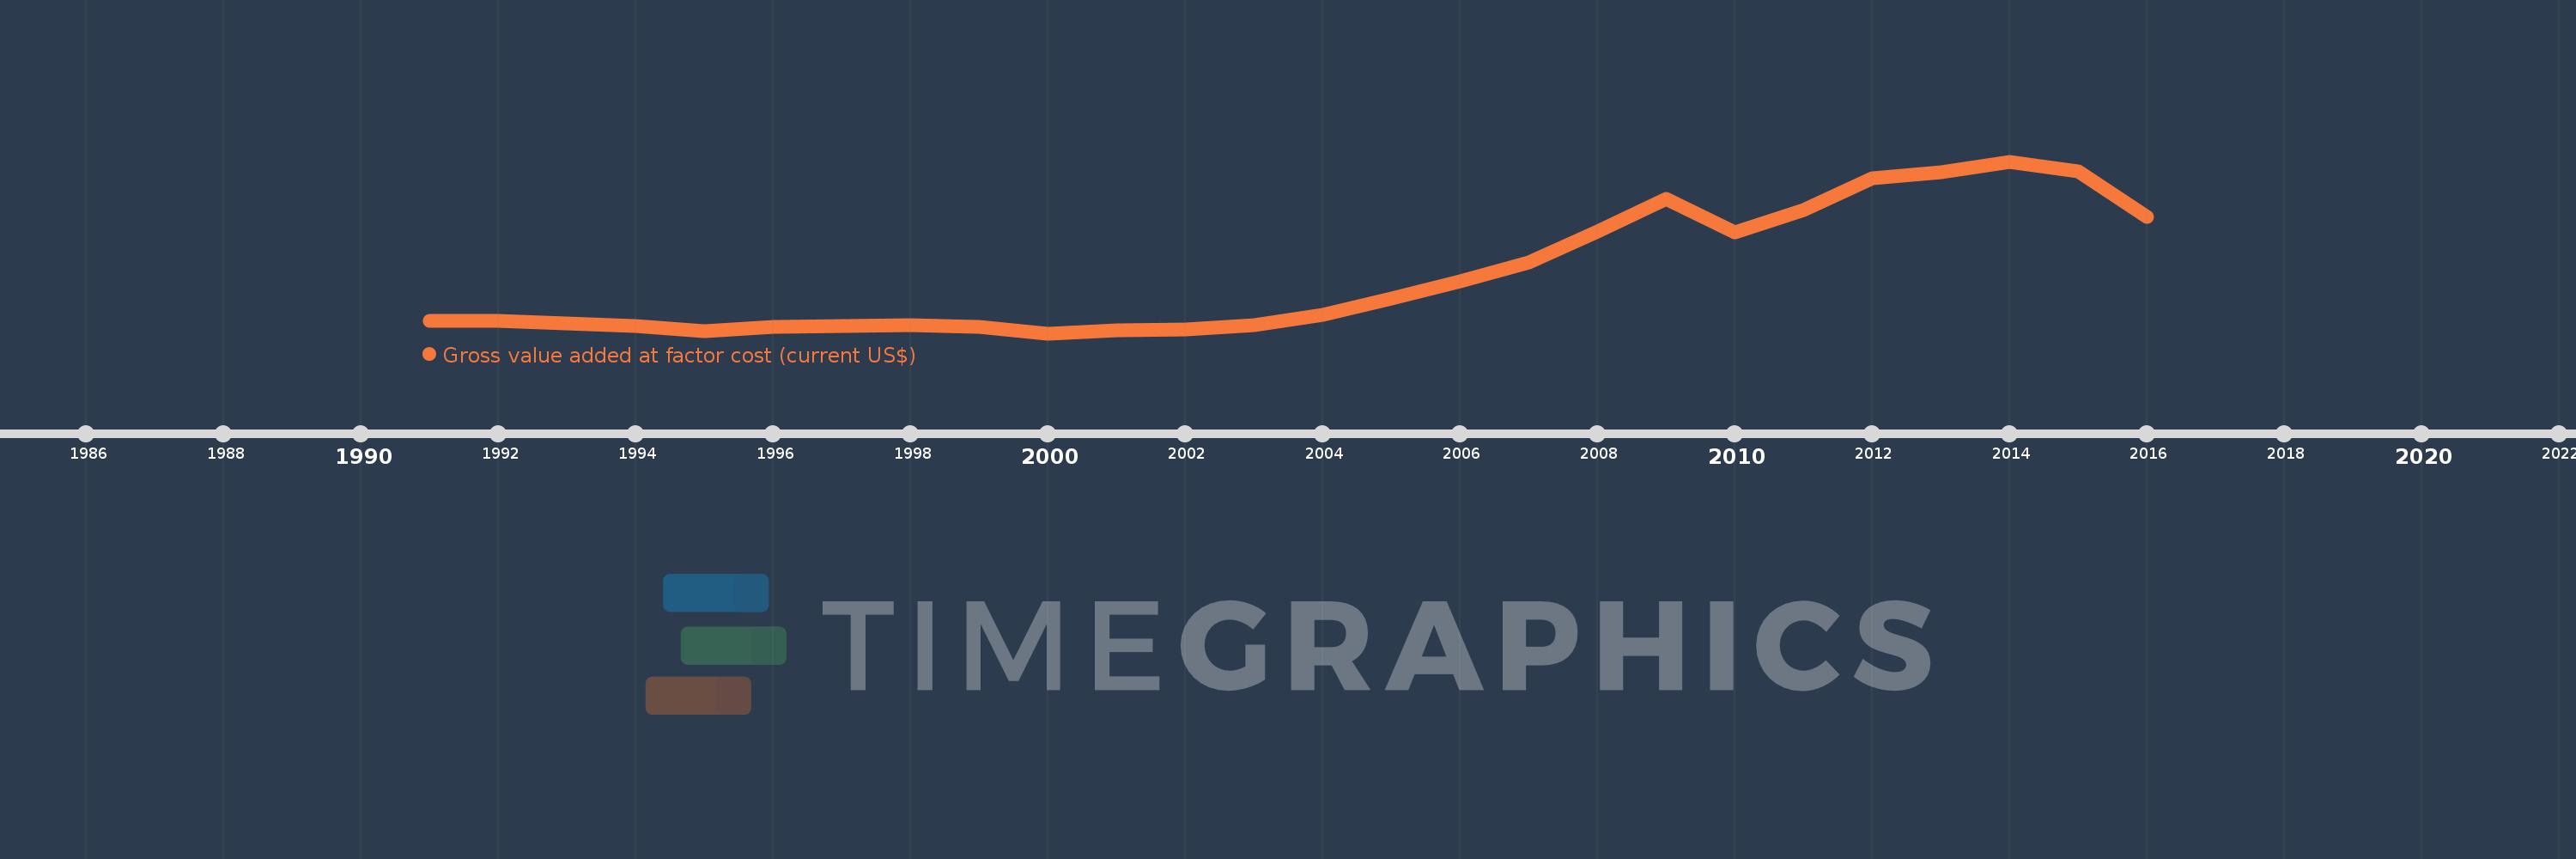
Gross value added at factor cost (current US$)
2016,2015,2014,2013,2012,2011,2010,2009,2008,2007,2006,2005,2004,2003,2002,2001,2000,1999,1998,1997,1996,1995,1994,1993,1992,1991
Estas estadísticas en otros países:
AfghanistanAlbaniaAlgeriaAndorraAntigua and BarbudaArgentinaArmeniaArubaAustraliaAustriaAzerbaijanBahamas, TheBahrainBangladeshBarbadosBelarusBelgiumBelizeBeninBermudaBhutanBoliviaBosnia and HerzegovinaBotswanaBrazilBulgariaBurkina FasoBurundiCabo VerdeCambodiaCameroonCanadaCaribbean small statesCayman IslandsCentral African RepublicCentral Europe and the BalticsChadChileColombiaCongo, Dem. Rep.Costa RicaCroatiaCubaCyprusCzech RepublicDenmarkDjiboutiDominicaDominican RepublicEarly-demographic dividendEcuadorEgypt, Arab Rep.El SalvadorEquatorial GuineaEritreaEstoniaEthiopiaEuro areaEurope & Central AsiaEurope & Central Asia (excluding high income)Europe & Central Asia (IDA & IBRD countries)European UnionFaroe IslandsFijiFinlandFranceGabonGambia, TheGeorgiaGermanyGhanaGreeceGrenadaGuatemalaGuineaGuinea-BissauGuyanaHeavily indebted poor countries (HIPC)High incomeHondurasHong Kong SAR, ChinaHungaryIcelandIDA blendIDA onlyIDA totalIndiaIndonesiaIran, Islamic Rep.IrelandItalyJamaicaJapanJordanKazakhstanKenyaKiribatiKorea, Rep.KosovoKuwaitKyrgyz RepublicLao PDRLatin America & Caribbean Latin America & Caribbean (excluding high income)Latin America & the Caribbean (IDA & IBRD countries)LatviaLeast developed countries: UN classificationLebanonLesothoLiberiaLibyaLiechtensteinLithuaniaLow incomeLower middle incomeLuxembourgMacao SAR, ChinaMacedonia, FYRMadagascarMalawiMalaysiaMaldivesMaliMaltaMarshall IslandsMauritaniaMauritiusMexicoMicronesia, Fed. Sts.Middle East & North Africa (excluding high income)Middle East & North Africa (IDA & IBRD countries)MoldovaMongoliaMontenegroMoroccoMozambiqueNamibiaNepalNetherlandsNew ZealandNicaraguaNigeriaNorth AmericaNorwayOECD membersOmanPacific island small statesPakistanPalauPanamaPapua New GuineaParaguayPeruPolandPortugalPost-demographic dividendPre-demographic dividendRomaniaRussian FederationRwandaSao Tome and PrincipeSenegalSerbiaSeychellesSierra LeoneSingaporeSlovak RepublicSloveniaSolomon IslandsSouth AfricaSouth AsiaSouth Asia (IDA & IBRD)SpainSri LankaSt. Kitts and NevisSt. LuciaSt. Vincent and the GrenadinesSub-Saharan Africa Sub-Saharan Africa (excluding high income)Sub-Saharan Africa (IDA & IBRD countries)SudanSurinameSwazilandSwedenSwitzerlandSyrian Arab RepublicTajikistanTanzaniaThailandTimor-LesteTongaTrinidad and TobagoTunisiaTurkeyTurkmenistanTuvaluUgandaUkraineUnited KingdomUnited StatesUruguayUzbekistanVanuatuVenezuela, RBVietnamWest Bank and GazaWorldYemen, Rep.ZambiaZimbabwe línea de tiempo (timeline):
En esta escala de tiempo se presenta un gráfico de 1991 y 2016 de Europe & Central Asia (IDA & IBRD countries). Los datos de 1990 están ausentes. El número de observaciones reales por fecha: 26.
Fuente (nombre):
Indicadores del desarrollo mundial
Fuente (organización):
World Bank national accounts data, and OECD National Accounts data files.
Categorías:
Economy & Growth
Se ha actualizado:
23 abr 2017 año
Los indicadores de los cambios de valor en los últimos años
En promedio:
1.857 billones
Mínimo:
727.283 bn
1 ene 2000 año
Máximo:
4.12 billones
1 ene 2014 año
A la fecha de observación
Valor
Cambio absoluto
El cambio con respecto al valor anterior
1 ene 1991 año
976.441 bn
+976.441 bn
0.0%
1 ene 1992 año
969.755 bn
-6.687 bn
-0.68%
1 ene 1993 año
917.863 bn
-51.892 bn
-5.35%
1 ene 1994 año
864.247 bn
-53.616 bn
-5.84%
1 ene 1995 año
769.129 bn
-95.118 bn
-11.01%
1 ene 1996 año
850.554 bn
+81.425 bn
10.59%
1 ene 1997 año
867.69 bn
+17.136 bn
2.01%
1 ene 1998 año
894.61 bn
+26.92 bn
3.1%
1 ene 1999 año
846.503 bn
-48.107 bn
-5.38%
1 ene 2000 año
727.283 bn
-119.219 bn
-14.08%
1 ene 2001 año
786.943 bn
+59.659 bn
8.2%
1 ene 2002 año
802.49 bn
+15.547 bn
1.98%
1 ene 2003 año
893.568 bn
+91.077 bn
11.35%
1 ene 2004 año
1.093 billones
+199.785 bn
22.36%
1 ene 2005 año
1.41 billones
+316.842 bn
28.98%
1 ene 2006 año
1.748 billones
+337.74 bn
23.95%
1 ene 2007 año
2.119 billones
+370.693 bn
21.21%
1 ene 2008 año
2.73 billones
+611.19 bn
28.85%
1 ene 2009 año
3.375 billones
+644.702 bn
23.62%
1 ene 2010 año
2.717 billones
-657.031 bn
-19.47%
1 ene 2011 año
3.16 billones
+442.741 bn
16.29%
1 ene 2012 año
3.795 billones
+634.511 bn
20.08%
1 ene 2013 año
3.902 billones
+107.316 bn
2.83%
1 ene 2014 año
4.12 billones
+218.104 bn
5.59%
1 ene 2015 año
3.921 billones
-198.923 bn
-4.83%
1 ene 2016 año
3.031 billones
-890.094 bn
-22.7%
Ranking de los países por los datos estadísticos actuales


Comentarios: