29
/es/
es
AIzaSyAYiBZKx7MnpbEhh9jyipgxe19OcubqV5w
April 1, 2024
54835
Post-demographic dividend
PST
false
2
1
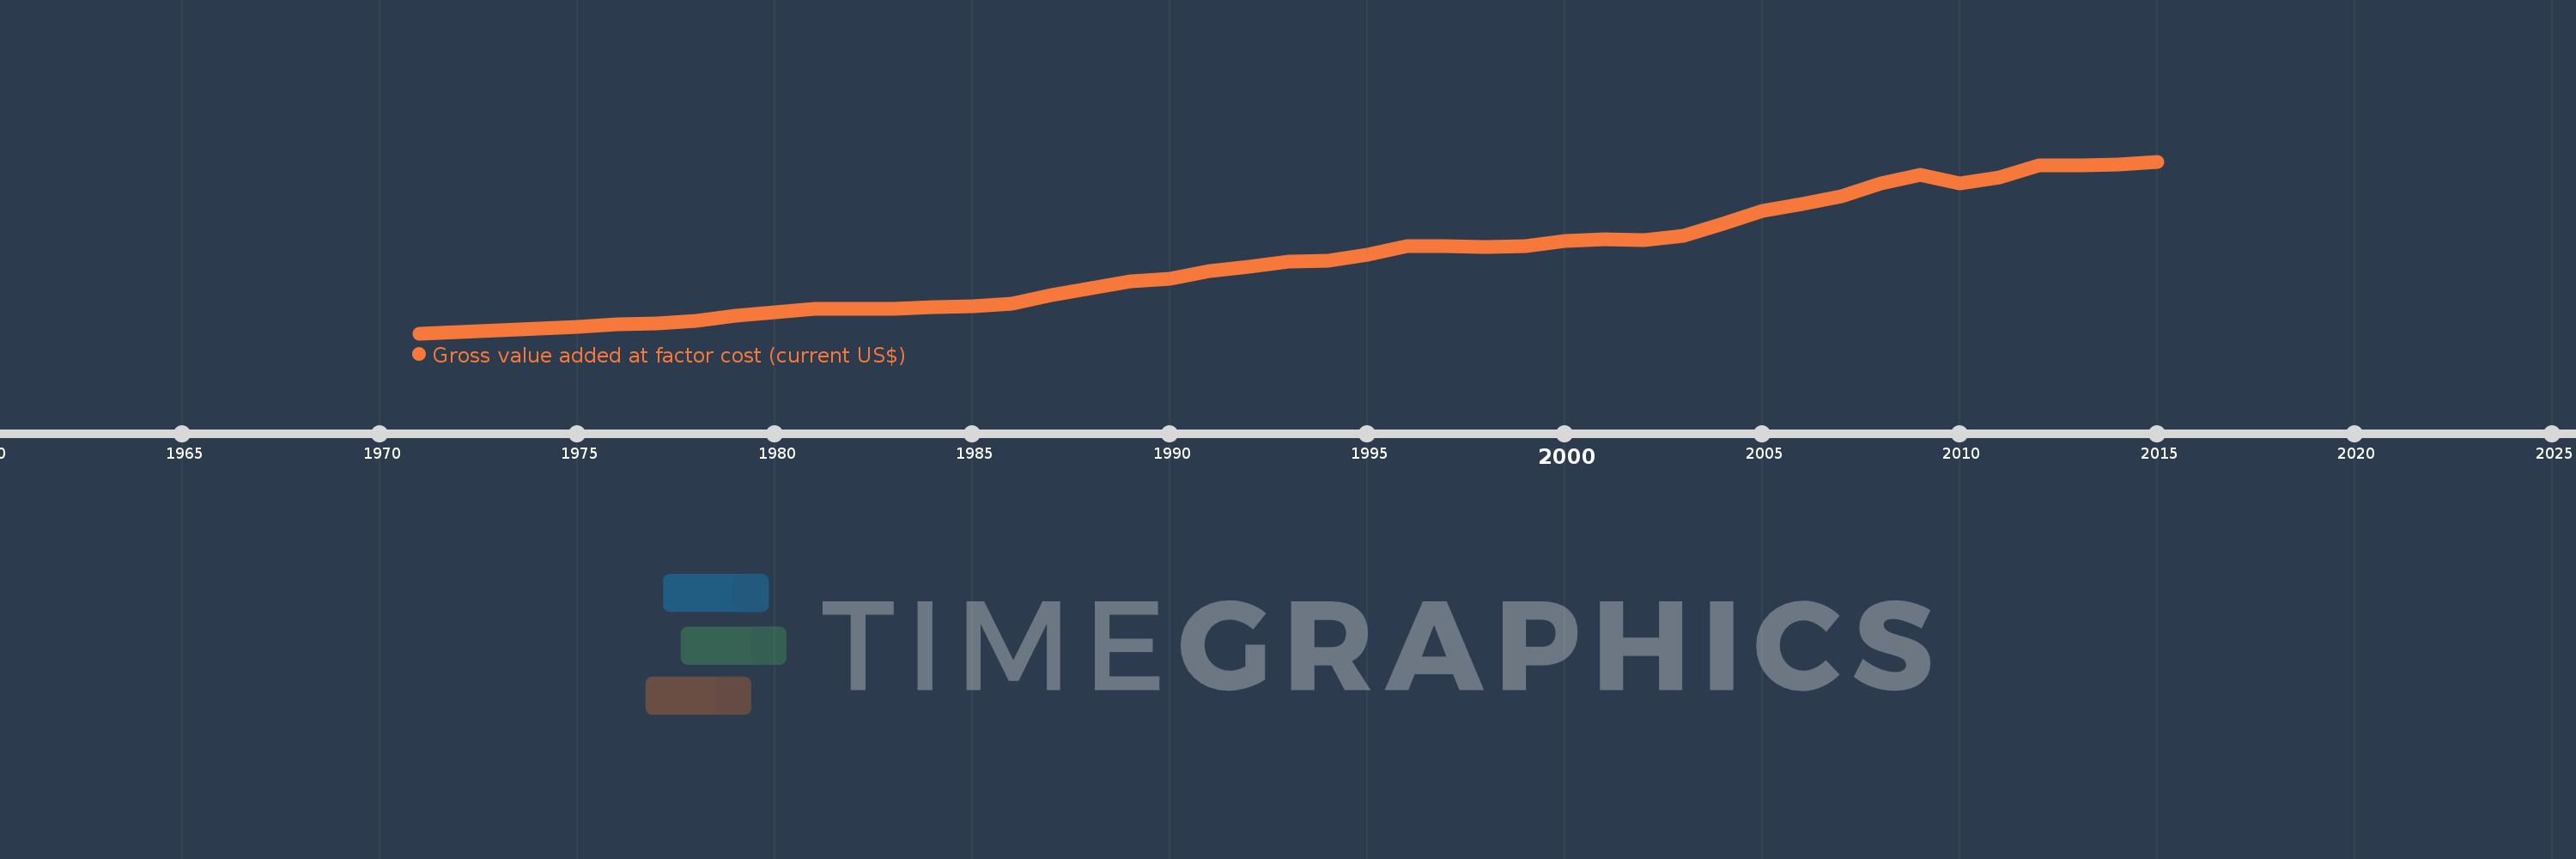
Gross value added at factor cost (current US$)
2015,2014,2013,2012,2011,2010,2009,2008,2007,2006,2005,2004,2003,2002,2001,2000,1999,1998,1997,1996,1995,1994,1993,1992,1991,1990,1989,1988,1987,1986,1985,1984,1983,1982,1981,1980,1979,1978,1977,1976,1975,1974,1973,1972,1971
Estas estadísticas en otros países:
AfghanistanAlbaniaAlgeriaAndorraAntigua and BarbudaArgentinaArmeniaArubaAustraliaAustriaAzerbaijanBahamas, TheBahrainBangladeshBarbadosBelarusBelgiumBelizeBeninBermudaBhutanBoliviaBosnia and HerzegovinaBotswanaBrazilBulgariaBurkina FasoBurundiCabo VerdeCambodiaCameroonCanadaCaribbean small statesCayman IslandsCentral African RepublicCentral Europe and the BalticsChadChileColombiaCongo, Dem. Rep.Costa RicaCroatiaCubaCyprusCzech RepublicDenmarkDjiboutiDominicaDominican RepublicEarly-demographic dividendEcuadorEgypt, Arab Rep.El SalvadorEquatorial GuineaEritreaEstoniaEthiopiaEuro areaEurope & Central AsiaEurope & Central Asia (excluding high income)Europe & Central Asia (IDA & IBRD countries)European UnionFaroe IslandsFijiFinlandFranceGabonGambia, TheGeorgiaGermanyGhanaGreeceGrenadaGuatemalaGuineaGuinea-BissauGuyanaHeavily indebted poor countries (HIPC)High incomeHondurasHong Kong SAR, ChinaHungaryIcelandIDA blendIDA onlyIDA totalIndiaIndonesiaIran, Islamic Rep.IrelandItalyJamaicaJapanJordanKazakhstanKenyaKiribatiKorea, Rep.KosovoKuwaitKyrgyz RepublicLao PDRLatin America & Caribbean Latin America & Caribbean (excluding high income)Latin America & the Caribbean (IDA & IBRD countries)LatviaLeast developed countries: UN classificationLebanonLesothoLiberiaLibyaLiechtensteinLithuaniaLow incomeLower middle incomeLuxembourgMacao SAR, ChinaMacedonia, FYRMadagascarMalawiMalaysiaMaldivesMaliMaltaMarshall IslandsMauritaniaMauritiusMexicoMicronesia, Fed. Sts.Middle East & North Africa (excluding high income)Middle East & North Africa (IDA & IBRD countries)MoldovaMongoliaMontenegroMoroccoMozambiqueNamibiaNepalNetherlandsNew ZealandNicaraguaNigeriaNorth AmericaNorwayOECD membersOmanPacific island small statesPakistanPalauPanamaPapua New GuineaParaguayPeruPolandPortugalPost-demographic dividendPre-demographic dividendRomaniaRussian FederationRwandaSao Tome and PrincipeSenegalSerbiaSeychellesSierra LeoneSingaporeSlovak RepublicSloveniaSolomon IslandsSouth AfricaSouth AsiaSouth Asia (IDA & IBRD)SpainSri LankaSt. Kitts and NevisSt. LuciaSt. Vincent and the GrenadinesSub-Saharan Africa Sub-Saharan Africa (excluding high income)Sub-Saharan Africa (IDA & IBRD countries)SudanSurinameSwazilandSwedenSwitzerlandSyrian Arab RepublicTajikistanTanzaniaThailandTimor-LesteTongaTrinidad and TobagoTunisiaTurkeyTurkmenistanTuvaluUgandaUkraineUnited KingdomUnited StatesUruguayUzbekistanVanuatuVenezuela, RBVietnamWest Bank and GazaWorldYemen, Rep.ZambiaZimbabwe línea de tiempo (timeline):
En esta escala de tiempo se presenta un gráfico de 1971 y 2015 de Post-demographic dividend. Los datos de 1970 están ausentes. El número de observaciones reales por fecha: 45.
Fuente (nombre):
Indicadores del desarrollo mundial
Fuente (organización):
World Bank national accounts data, and OECD National Accounts data files.
Categorías:
Economy & Growth
Se ha actualizado:
23 abr 2017 año
Los indicadores de los cambios de valor en los últimos años
En promedio:
19.742 billones
Mínimo:
2.173 billones
1 ene 1971 año
Máximo:
43.365 billones
1 ene 2015 año
A la fecha de observación
Valor
Cambio absoluto
El cambio con respecto al valor anterior
1 ene 1971 año
2.173 billones
+2.173 billones
0.0%
1 ene 1972 año
2.409 billones
+236.699 bn
10.89%
1 ene 1973 año
2.806 billones
+396.256 bn
16.45%
1 ene 1974 año
3.395 billones
+589.188 bn
21.0%
1 ene 1975 año
3.8 billones
+405.204 bn
11.94%
1 ene 1976 año
4.266 billones
+466.088 bn
12.27%
1 ene 1977 año
4.624 billones
+358.189 bn
8.4%
1 ene 1978 año
5.228 billones
+604.127 bn
13.06%
1 ene 1979 año
6.299 billones
+1.071 billones
20.48%
1 ene 1980 año
7.242 billones
+943.128 bn
14.97%
1 ene 1981 año
8.015 billones
+772.589 bn
10.67%
1 ene 1982 año
8.096 billones
+80.909 bn
1.01%
1 ene 1983 año
8.057 billones
-39.051 bn
-0.48%
1 ene 1984 año
8.367 billones
+310.154 bn
3.85%
1 ene 1985 año
8.743 billones
+376.359 bn
4.5%
1 ene 1986 año
9.212 billones
+468.747 bn
5.36%
1 ene 1987 año
11.246 billones
+2.034 billones
22.08%
1 ene 1988 año
13.037 billones
+1.792 billones
15.93%
1 ene 1989 año
14.672 billones
+1.635 billones
12.54%
1 ene 1990 año
15.304 billones
+632.32 bn
4.31%
1 ene 1991 año
17.16 billones
+1.856 billones
12.13%
1 ene 1992 año
18.086 billones
+925.835 bn
5.4%
1 ene 1993 año
19.414 billones
+1.328 billones
7.34%
1 ene 1994 año
19.621 billones
+207.064 bn
1.07%
1 ene 1995 año
20.937 billones
+1.316 billones
6.71%
1 ene 1996 año
23.063 billones
+2.126 billones
10.15%
1 ene 1997 año
23.126 billones
+63.151 bn
0.27%
1 ene 1998 año
22.963 billones
-163.46 bn
-0.71%
1 ene 1999 año
23.037 billones
+74.767 bn
0.33%
1 ene 2000 año
24.225 billones
+1.188 billones
5.15%
1 ene 2001 año
24.674 billones
+448.636 bn
1.85%
1 ene 2002 año
24.446 billones
-227.416 bn
-0.92%
1 ene 2003 año
25.462 billones
+1.016 billones
4.16%
1 ene 2004 año
28.507 billones
+3.045 billones
11.96%
1 ene 2005 año
31.62 billones
+3.113 billones
10.92%
1 ene 2006 año
33.253 billones
+1.633 billones
5.17%
1 ene 2007 año
34.922 billones
+1.669 billones
5.02%
1 ene 2008 año
38.057 billones
+3.134 billones
8.98%
1 ene 2009 año
40.237 billones
+2.181 billones
5.73%
1 ene 2010 año
38.039 billones
-2.198 billones
-5.46%
1 ene 2011 año
39.628 billones
+1.588 billones
4.18%
1 ene 2012 año
42.457 billones
+2.829 billones
7.14%
1 ene 2013 año
42.448 billones
-8.563 bn
-0.02%
1 ene 2014 año
42.65 billones
+202.25 bn
0.48%
1 ene 2015 año
43.365 billones
+714.941 bn
1.68%
Ranking de los países por los datos estadísticos actuales


Comentarios: