29
/es/
es
AIzaSyAYiBZKx7MnpbEhh9jyipgxe19OcubqV5w
April 1, 2024
163839
Japan
JPN
true
2
1
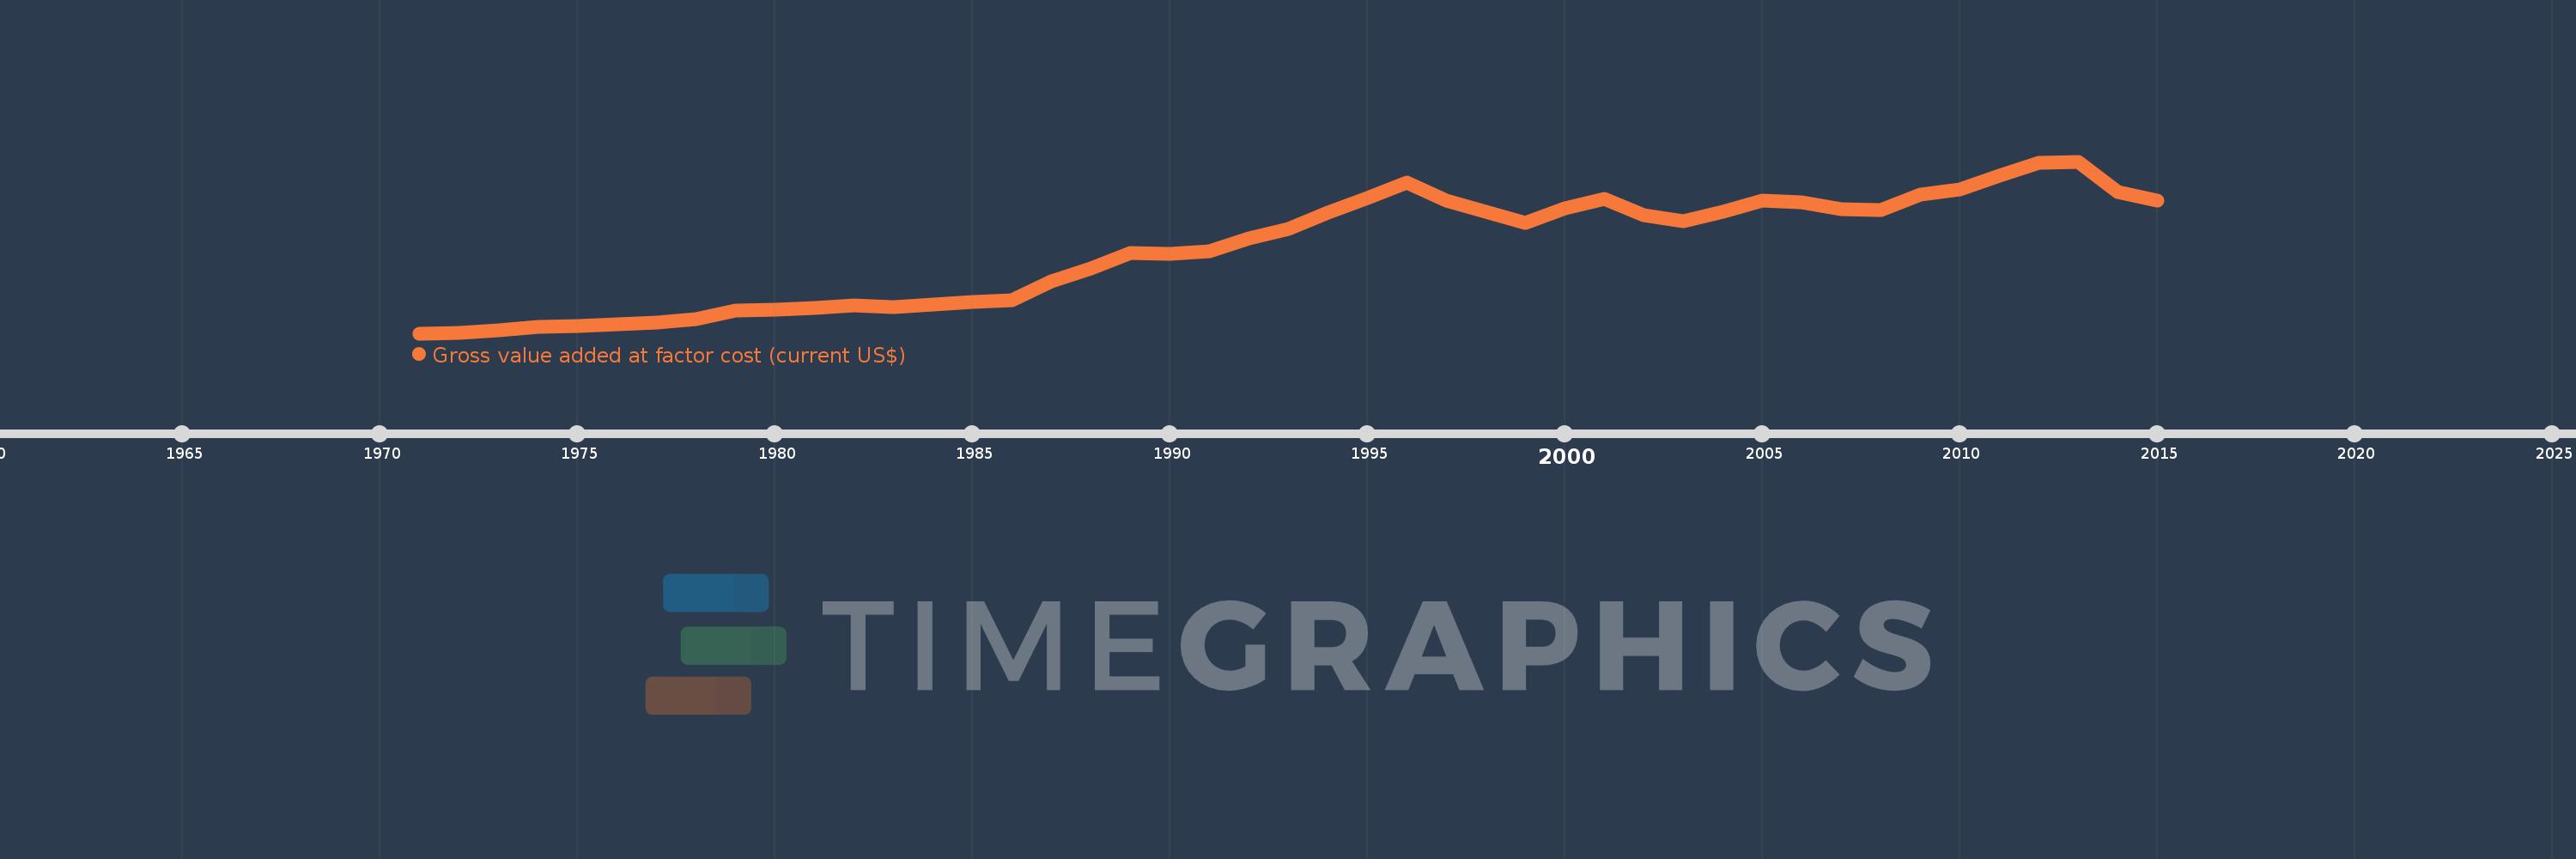
Gross value added at factor cost (current US$)
2015,2014,2013,2012,2011,2010,2009,2008,2007,2006,2005,2004,2003,2002,2001,2000,1999,1998,1997,1996,1995,1994,1993,1992,1991,1990,1989,1988,1987,1986,1985,1984,1983,1982,1981,1980,1979,1978,1977,1976,1975,1974,1973,1972,1971
Estas estadísticas en otros países:
AfghanistanAlbaniaAlgeriaAndorraAntigua and BarbudaArgentinaArmeniaArubaAustraliaAustriaAzerbaijanBahamas, TheBahrainBangladeshBarbadosBelarusBelgiumBelizeBeninBermudaBhutanBoliviaBosnia and HerzegovinaBotswanaBrazilBulgariaBurkina FasoBurundiCabo VerdeCambodiaCameroonCanadaCaribbean small statesCayman IslandsCentral African RepublicCentral Europe and the BalticsChadChileColombiaCongo, Dem. Rep.Costa RicaCroatiaCubaCyprusCzech RepublicDenmarkDjiboutiDominicaDominican RepublicEarly-demographic dividendEcuadorEgypt, Arab Rep.El SalvadorEquatorial GuineaEritreaEstoniaEthiopiaEuro areaEurope & Central AsiaEurope & Central Asia (excluding high income)Europe & Central Asia (IDA & IBRD countries)European UnionFaroe IslandsFijiFinlandFranceGabonGambia, TheGeorgiaGermanyGhanaGreeceGrenadaGuatemalaGuineaGuinea-BissauGuyanaHeavily indebted poor countries (HIPC)High incomeHondurasHong Kong SAR, ChinaHungaryIcelandIDA blendIDA onlyIDA totalIndiaIndonesiaIran, Islamic Rep.IrelandItalyJamaicaJapanJordanKazakhstanKenyaKiribatiKorea, Rep.KosovoKuwaitKyrgyz RepublicLao PDRLatin America & Caribbean Latin America & Caribbean (excluding high income)Latin America & the Caribbean (IDA & IBRD countries)LatviaLeast developed countries: UN classificationLebanonLesothoLiberiaLibyaLiechtensteinLithuaniaLow incomeLower middle incomeLuxembourgMacao SAR, ChinaMacedonia, FYRMadagascarMalawiMalaysiaMaldivesMaliMaltaMarshall IslandsMauritaniaMauritiusMexicoMicronesia, Fed. Sts.Middle East & North Africa (excluding high income)Middle East & North Africa (IDA & IBRD countries)MoldovaMongoliaMontenegroMoroccoMozambiqueNamibiaNepalNetherlandsNew ZealandNicaraguaNigeriaNorth AmericaNorwayOECD membersOmanPacific island small statesPakistanPalauPanamaPapua New GuineaParaguayPeruPolandPortugalPost-demographic dividendPre-demographic dividendRomaniaRussian FederationRwandaSao Tome and PrincipeSenegalSerbiaSeychellesSierra LeoneSingaporeSlovak RepublicSloveniaSolomon IslandsSouth AfricaSouth AsiaSouth Asia (IDA & IBRD)SpainSri LankaSt. Kitts and NevisSt. LuciaSt. Vincent and the GrenadinesSub-Saharan Africa Sub-Saharan Africa (excluding high income)Sub-Saharan Africa (IDA & IBRD countries)SudanSurinameSwazilandSwedenSwitzerlandSyrian Arab RepublicTajikistanTanzaniaThailandTimor-LesteTongaTrinidad and TobagoTunisiaTurkeyTurkmenistanTuvaluUgandaUkraineUnited KingdomUnited StatesUruguayUzbekistanVanuatuVenezuela, RBVietnamWest Bank and GazaWorldYemen, Rep.ZambiaZimbabwe línea de tiempo (timeline):
En esta escala de tiempo se presenta un gráfico de 1971 y 2015 de Japan. Los datos de 1970 están ausentes. El número de observaciones reales por fecha: 45.
Fuente (nombre):
Indicadores del desarrollo mundial
Fuente (organización):
World Bank national accounts data, and OECD National Accounts data files.
Categorías:
Economy & Growth
Se ha actualizado:
23 abr 2017 año
Los indicadores de los cambios de valor en los últimos años
En promedio:
3.12 billones
Mínimo:
206.906 bn
1 ene 1971 año
Máximo:
6.166 billones
1 ene 2013 año
A la fecha de observación
Valor
Cambio absoluto
El cambio con respecto al valor anterior
1 ene 1971 año
206.906 bn
+206.906 bn
0.0%
1 ene 1972 año
233.727 bn
+26.821 bn
12.96%
1 ene 1973 año
311.844 bn
+78.117 bn
33.42%
1 ene 1974 año
427.344 bn
+115.5 bn
37.04%
1 ene 1975 año
471.47 bn
+44.126 bn
10.33%
1 ene 1976 año
510.824 bn
+39.354 bn
8.35%
1 ene 1977 año
575.257 bn
+64.432 bn
12.61%
1 ene 1978 año
703.663 bn
+128.406 bn
22.32%
1 ene 1979 año
988.566 bn
+284.903 bn
40.49%
1 ene 1980 año
1.032 billones
+43.912 bn
4.44%
1 ene 1981 año
1.08 billones
+47.45 bn
4.6%
1 ene 1982 año
1.187 billones
+106.823 bn
9.89%
1 ene 1983 año
1.105 billones
-81.284 bn
-6.85%
1 ene 1984 año
1.208 billones
+102.063 bn
9.23%
1 ene 1985 año
1.282 billones
+74.736 bn
6.19%
1 ene 1986 año
1.363 billones
+80.339 bn
6.27%
1 ene 1987 año
2.015 billones
+652.047 bn
47.85%
1 ene 1988 año
2.466 billones
+451.747 bn
22.42%
1 ene 1989 año
2.984 billones
+517.387 bn
20.98%
1 ene 1990 año
2.974 billones
-10.253 bn
-0.34%
1 ene 1991 año
3.056 billones
+82.789 bn
2.78%
1 ene 1992 año
3.498 billones
+441.548 bn
14.45%
1 ene 1993 año
3.82 billones
+321.631 bn
9.2%
1 ene 1994 año
4.378 billones
+558.903 bn
14.63%
1 ene 1995 año
4.898 billones
+519.399 bn
11.86%
1 ene 1996 año
5.439 billones
+540.741 bn
11.04%
1 ene 1997 año
4.824 billones
-614.735 bn
-11.3%
1 ene 1998 año
4.41 billones
-413.762 bn
-8.58%
1 ene 1999 año
4.029 billones
-381.128 bn
-8.64%
1 ene 2000 año
4.556 billones
+526.794 bn
13.08%
1 ene 2001 año
4.881 billones
+324.808 bn
7.13%
1 ene 2002 año
4.296 billones
-584.546 bn
-11.98%
1 ene 2003 año
4.105 billones
-190.537 bn
-4.44%
1 ene 2004 año
4.435 billones
+329.517 bn
8.03%
1 ene 2005 año
4.804 billones
+369.017 bn
8.32%
1 ene 2006 año
4.738 billones
-65.888 bn
-1.37%
1 ene 2007 año
4.51 billones
-228.554 bn
-4.82%
1 ene 2008 año
4.496 billones
-13.435 bn
-0.3%
1 ene 2009 año
5.013 billones
+517.231 bn
11.5%
1 ene 2010 año
5.21 billones
+197.125 bn
3.93%
1 ene 2011 año
5.674 billones
+463.972 bn
8.9%
1 ene 2012 año
6.121 billones
+446.189 bn
7.86%
1 ene 2013 año
6.166 billones
+45.183 bn
0.74%
1 ene 2014 año
5.118 billones
-1.048 billones
-17.0%
1 ene 2015 año
4.806 billones
-312.015 bn
-6.1%
Ranking de los países por los datos estadísticos actuales


Comentarios: