29
/es/
es
AIzaSyAYiBZKx7MnpbEhh9jyipgxe19OcubqV5w
April 1, 2024
123574
Ecuador
ECU
true
2
1
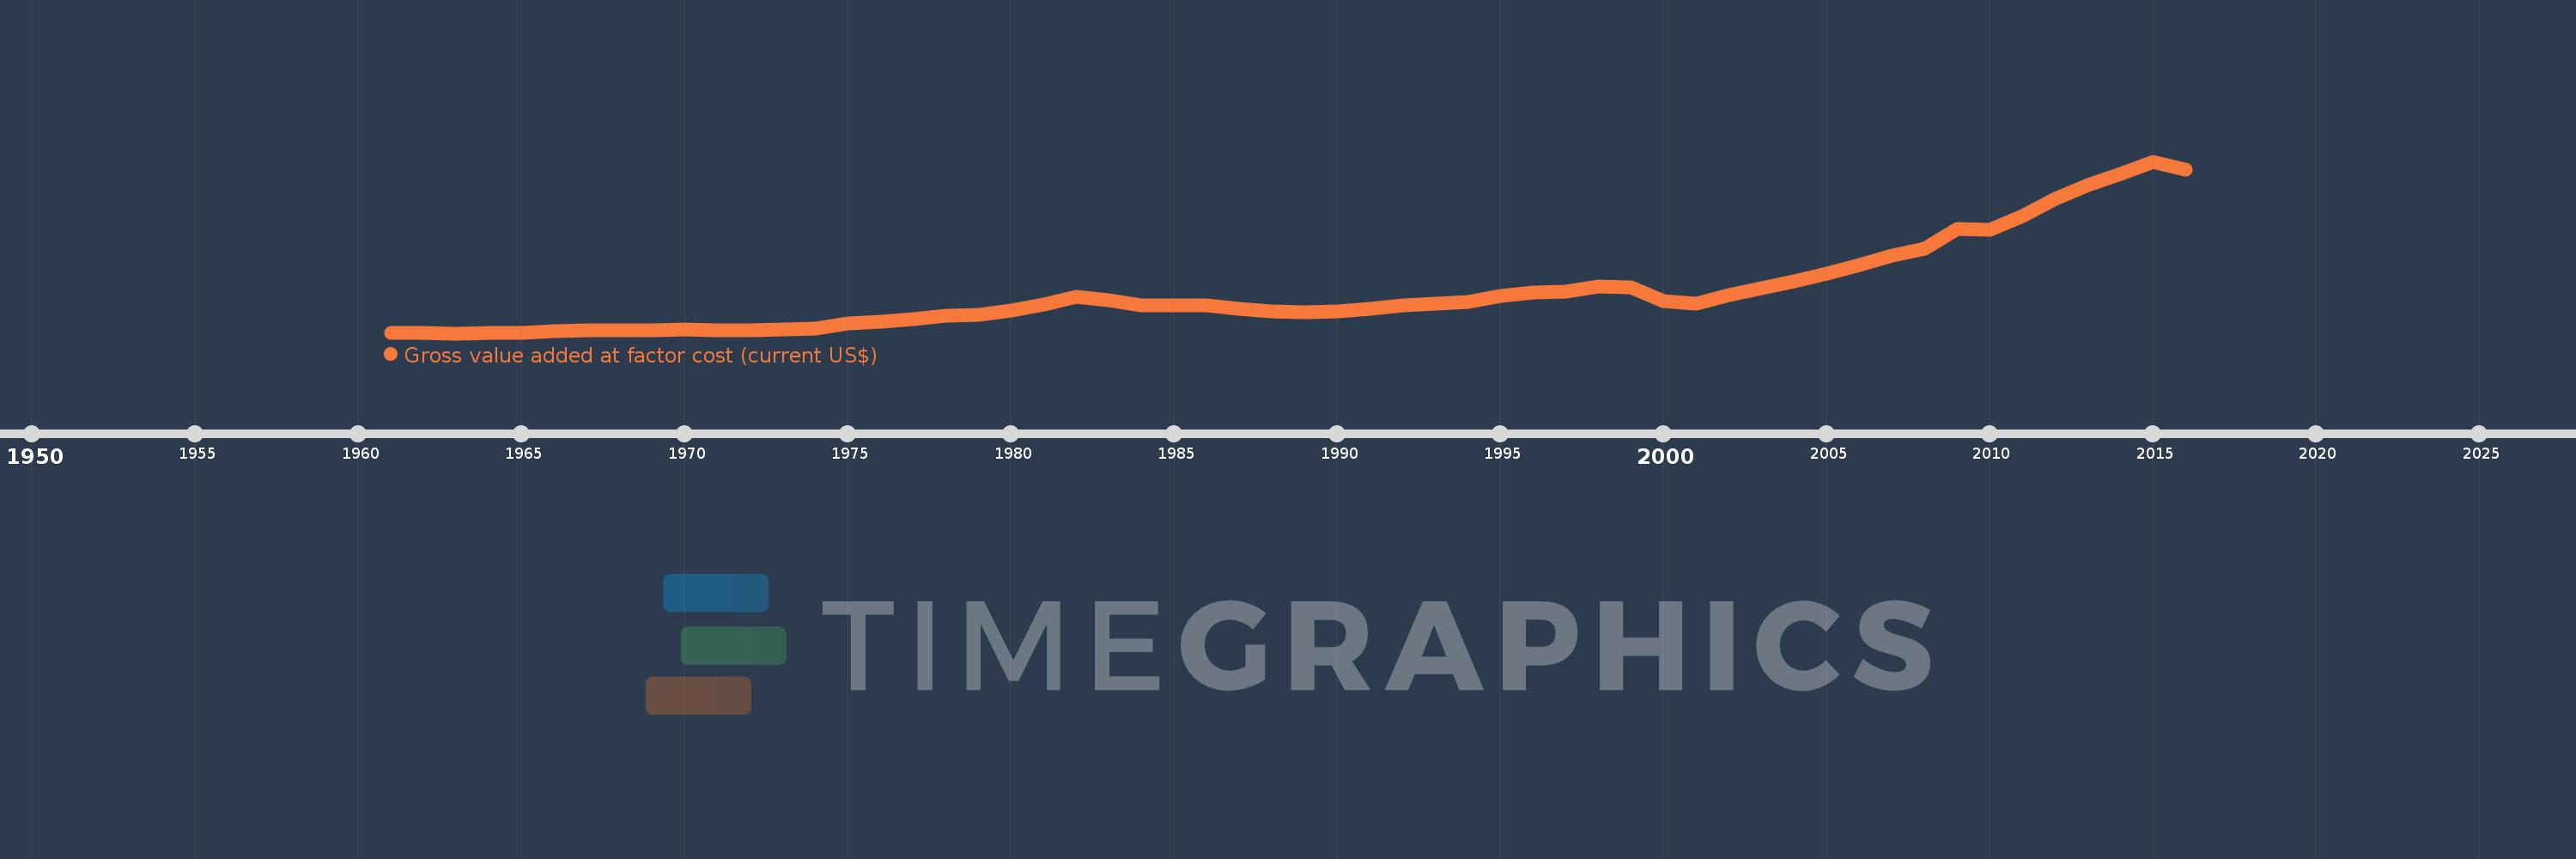
Gross value added at factor cost (current US$)
2016,2015,2014,2013,2012,2011,2010,2009,2008,2007,2006,2005,2004,2003,2002,2001,2000,1999,1998,1997,1996,1995,1994,1993,1992,1991,1990,1989,1988,1987,1986,1985,1984,1983,1982,1981,1980,1979,1978,1977,1976,1975,1974,1973,1972,1971,1970,1969,1968,1967,1966,1965,1964,1963,1962,1961
Estas estadísticas en otros países:
AfghanistanAlbaniaAlgeriaAndorraAntigua and BarbudaArgentinaArmeniaArubaAustraliaAustriaAzerbaijanBahamas, TheBahrainBangladeshBarbadosBelarusBelgiumBelizeBeninBermudaBhutanBoliviaBosnia and HerzegovinaBotswanaBrazilBulgariaBurkina FasoBurundiCabo VerdeCambodiaCameroonCanadaCaribbean small statesCayman IslandsCentral African RepublicCentral Europe and the BalticsChadChileColombiaCongo, Dem. Rep.Costa RicaCroatiaCubaCyprusCzech RepublicDenmarkDjiboutiDominicaDominican RepublicEarly-demographic dividendEcuadorEgypt, Arab Rep.El SalvadorEquatorial GuineaEritreaEstoniaEthiopiaEuro areaEurope & Central AsiaEurope & Central Asia (excluding high income)Europe & Central Asia (IDA & IBRD countries)European UnionFaroe IslandsFijiFinlandFranceGabonGambia, TheGeorgiaGermanyGhanaGreeceGrenadaGuatemalaGuineaGuinea-BissauGuyanaHeavily indebted poor countries (HIPC)High incomeHondurasHong Kong SAR, ChinaHungaryIcelandIDA blendIDA onlyIDA totalIndiaIndonesiaIran, Islamic Rep.IrelandItalyJamaicaJapanJordanKazakhstanKenyaKiribatiKorea, Rep.KosovoKuwaitKyrgyz RepublicLao PDRLatin America & Caribbean Latin America & Caribbean (excluding high income)Latin America & the Caribbean (IDA & IBRD countries)LatviaLeast developed countries: UN classificationLebanonLesothoLiberiaLibyaLiechtensteinLithuaniaLow incomeLower middle incomeLuxembourgMacao SAR, ChinaMacedonia, FYRMadagascarMalawiMalaysiaMaldivesMaliMaltaMarshall IslandsMauritaniaMauritiusMexicoMicronesia, Fed. Sts.Middle East & North Africa (excluding high income)Middle East & North Africa (IDA & IBRD countries)MoldovaMongoliaMontenegroMoroccoMozambiqueNamibiaNepalNetherlandsNew ZealandNicaraguaNigeriaNorth AmericaNorwayOECD membersOmanPacific island small statesPakistanPalauPanamaPapua New GuineaParaguayPeruPolandPortugalPost-demographic dividendPre-demographic dividendRomaniaRussian FederationRwandaSao Tome and PrincipeSenegalSerbiaSeychellesSierra LeoneSingaporeSlovak RepublicSloveniaSolomon IslandsSouth AfricaSouth AsiaSouth Asia (IDA & IBRD)SpainSri LankaSt. Kitts and NevisSt. LuciaSt. Vincent and the GrenadinesSub-Saharan Africa Sub-Saharan Africa (excluding high income)Sub-Saharan Africa (IDA & IBRD countries)SudanSurinameSwazilandSwedenSwitzerlandSyrian Arab RepublicTajikistanTanzaniaThailandTimor-LesteTongaTrinidad and TobagoTunisiaTurkeyTurkmenistanTuvaluUgandaUkraineUnited KingdomUnited StatesUruguayUzbekistanVanuatuVenezuela, RBVietnamWest Bank and GazaWorldYemen, Rep.ZambiaZimbabwe línea de tiempo (timeline):
En esta escala de tiempo se presenta un gráfico de 1961 y 2016 de Ecuador. Los datos de 1960 están ausentes. El número de observaciones reales por fecha: 56.
Fuente (nombre):
Indicadores del desarrollo mundial
Fuente (organización):
World Bank national accounts data, and OECD National Accounts data files.
Categorías:
Economy & Growth
Se ha actualizado:
23 abr 2017 año
Los indicadores de los cambios de valor en los últimos años
Mínimo:
868.336 millones
1 ene 1963 año
Máximo:
97.317 bn
1 ene 2015 año
A la fecha de observación
Valor
Cambio absoluto
El cambio con respecto al valor anterior
1 ene 1961 año
900.004 millones
+900.004 millones
0.0%
1 ene 1962 año
880.641 millones
-19.364 millones
-2.15%
1 ene 1963 año
868.336 millones
-12.305 millones
-1.4%
1 ene 1964 año
928.626 millones
+60.29 millones
6.94%
1 ene 1965 año
1.027 bn
+98.26 millones
10.58%
1 ene 1966 año
2.297 bn
+1.27 bn
123.67%
1 ene 1967 año
2.327 bn
+30.396 millones
1.32%
1 ene 1968 año
2.43 bn
+102.721 millones
4.41%
1 ene 1969 año
2.454 bn
+23.664 millones
0.97%
1 ene 1970 año
2.977 bn
+523.423 millones
21.33%
1 ene 1971 año
2.723 bn
-253.545 millones
-8.52%
1 ene 1972 año
2.619 bn
-104.923 millones
-3.85%
1 ene 1973 año
3.024 bn
+405.533 millones
15.49%
1 ene 1974 año
3.67 bn
+646.362 millones
21.37%
1 ene 1975 año
6.354 bn
+2.684 bn
73.12%
1 ene 1976 año
7.465 bn
+1.111 bn
17.48%
1 ene 1977 año
8.768 bn
+1.303 bn
17.45%
1 ene 1978 año
10.573 bn
+1.805 bn
20.59%
1 ene 1979 año
11.381 bn
+807.377 millones
7.64%
1 ene 1980 año
13.587 bn
+2.207 bn
19.39%
1 ene 1981 año
17.213 bn
+3.626 bn
26.69%
1 ene 1982 año
21.159 bn
+3.946 bn
22.93%
1 ene 1983 año
19.4 bn
-1.759 bn
-8.31%
1 ene 1984 año
16.669 bn
-2.731 bn
-14.08%
1 ene 1985 año
16.322 bn
-347.469 millones
-2.08%
1 ene 1986 año
16.487 bn
+164.921 millones
1.01%
1 ene 1987 año
14.585 bn
-1.902 bn
-11.54%
1 ene 1988 año
13.313 bn
-1.272 bn
-8.72%
1 ene 1989 año
12.47 bn
-842.795 millones
-6.33%
1 ene 1990 año
13.3 bn
+829.788 millones
6.65%
1 ene 1991 año
14.594 bn
+1.295 bn
9.73%
1 ene 1992 año
16.308 bn
+1.713 bn
11.74%
1 ene 1993 año
17.396 bn
+1.088 bn
6.67%
1 ene 1994 año
18.233 bn
+837.219 millones
4.81%
1 ene 1995 año
21.898 bn
+3.665 bn
20.1%
1 ene 1996 año
23.666 bn
+1.768 bn
8.07%
1 ene 1997 año
24.47 bn
+804.06 millones
3.4%
1 ene 1998 año
27.083 bn
+2.613 bn
10.68%
1 ene 1999 año
26.689 bn
-394.575 millones
-1.46%
1 ene 2000 año
18.834 bn
-7.855 bn
-29.43%
1 ene 2001 año
17.281 bn
-1.553 bn
-8.24%
1 ene 2002 año
22.532 bn
+5.251 bn
30.39%
1 ene 2003 año
26.24 bn
+3.708 bn
16.45%
1 ene 2004 año
30.171 bn
+3.931 bn
14.98%
1 ene 2005 año
34.198 bn
+4.027 bn
13.35%
1 ene 2006 año
39.205 bn
+5.007 bn
14.64%
1 ene 2007 año
44.497 bn
+5.292 bn
13.5%
1 ene 2008 año
48.511 bn
+4.014 bn
9.02%
1 ene 2009 año
59.551 bn
+11.04 bn
22.76%
1 ene 2010 año
59.013 bn
-537.627 millones
-0.9%
1 ene 2011 año
66.499 bn
+7.486 bn
12.69%
1 ene 2012 año
76.536 bn
+10.037 bn
15.09%
1 ene 2013 año
83.856 bn
+7.32 bn
9.56%
1 ene 2014 año
90.534 bn
+6.678 bn
7.96%
1 ene 2015 año
97.317 bn
+6.783 bn
7.49%
1 ene 2016 año
92.746 bn
-4.571 bn
-4.7%
Ranking de los países por los datos estadísticos actuales


Comentarios: