29
/es/
es
AIzaSyAYiBZKx7MnpbEhh9jyipgxe19OcubqV5w
April 1, 2024
203003
Mozambique
MOZ
true
2
1
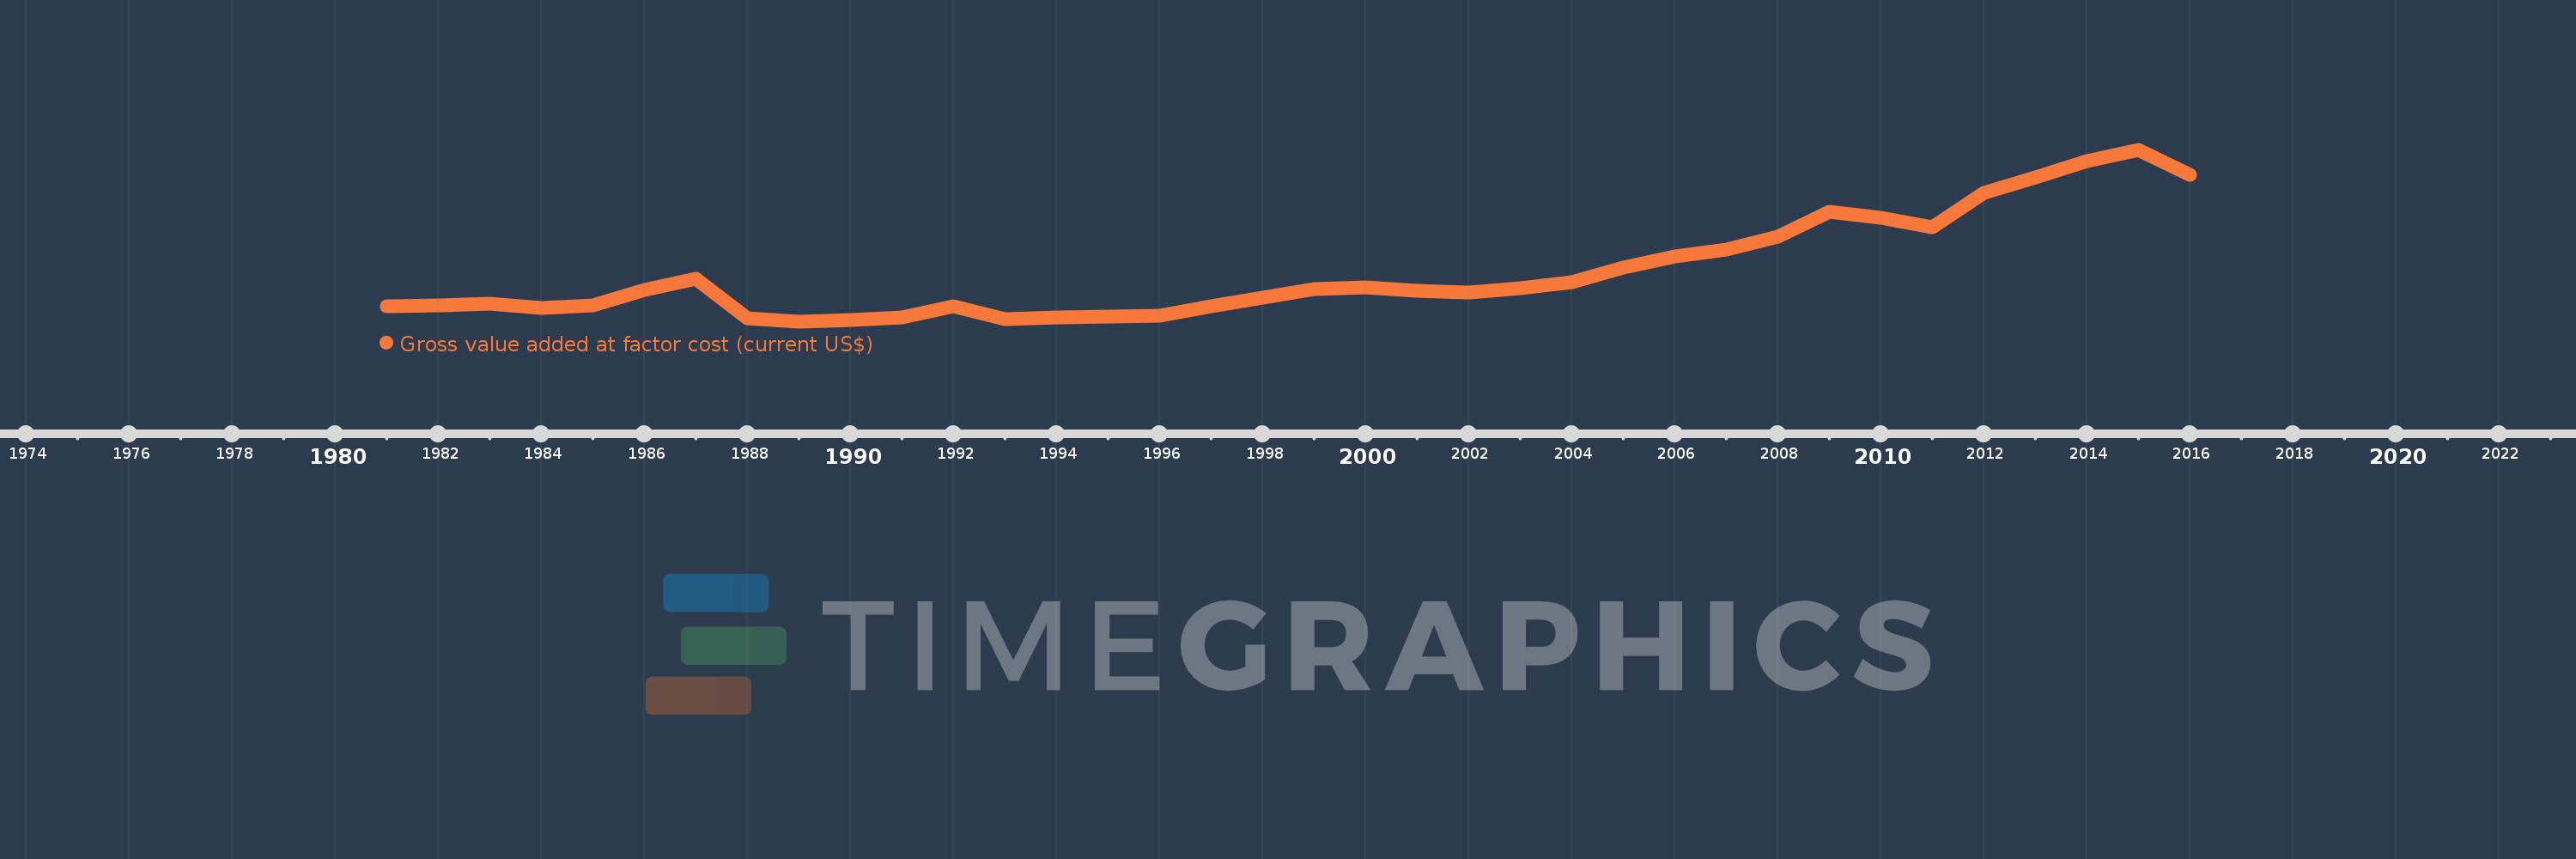
Gross value added at factor cost (current US$)
2016,2015,2014,2013,2012,2011,2010,2009,2008,2007,2006,2005,2004,2003,2002,2001,2000,1999,1998,1997,1996,1995,1994,1993,1992,1991,1990,1989,1988,1987,1986,1985,1984,1983,1982,1981
Estas estadísticas en otros países:
AfghanistanAlbaniaAlgeriaAndorraAntigua and BarbudaArgentinaArmeniaArubaAustraliaAustriaAzerbaijanBahamas, TheBahrainBangladeshBarbadosBelarusBelgiumBelizeBeninBermudaBhutanBoliviaBosnia and HerzegovinaBotswanaBrazilBulgariaBurkina FasoBurundiCabo VerdeCambodiaCameroonCanadaCaribbean small statesCayman IslandsCentral African RepublicCentral Europe and the BalticsChadChileColombiaCongo, Dem. Rep.Costa RicaCroatiaCubaCyprusCzech RepublicDenmarkDjiboutiDominicaDominican RepublicEarly-demographic dividendEcuadorEgypt, Arab Rep.El SalvadorEquatorial GuineaEritreaEstoniaEthiopiaEuro areaEurope & Central AsiaEurope & Central Asia (excluding high income)Europe & Central Asia (IDA & IBRD countries)European UnionFaroe IslandsFijiFinlandFranceGabonGambia, TheGeorgiaGermanyGhanaGreeceGrenadaGuatemalaGuineaGuinea-BissauGuyanaHeavily indebted poor countries (HIPC)High incomeHondurasHong Kong SAR, ChinaHungaryIcelandIDA blendIDA onlyIDA totalIndiaIndonesiaIran, Islamic Rep.IrelandItalyJamaicaJapanJordanKazakhstanKenyaKiribatiKorea, Rep.KosovoKuwaitKyrgyz RepublicLao PDRLatin America & Caribbean Latin America & Caribbean (excluding high income)Latin America & the Caribbean (IDA & IBRD countries)LatviaLeast developed countries: UN classificationLebanonLesothoLiberiaLibyaLiechtensteinLithuaniaLow incomeLower middle incomeLuxembourgMacao SAR, ChinaMacedonia, FYRMadagascarMalawiMalaysiaMaldivesMaliMaltaMarshall IslandsMauritaniaMauritiusMexicoMicronesia, Fed. Sts.Middle East & North Africa (excluding high income)Middle East & North Africa (IDA & IBRD countries)MoldovaMongoliaMontenegroMoroccoMozambiqueNamibiaNepalNetherlandsNew ZealandNicaraguaNigeriaNorth AmericaNorwayOECD membersOmanPacific island small statesPakistanPalauPanamaPapua New GuineaParaguayPeruPolandPortugalPost-demographic dividendPre-demographic dividendRomaniaRussian FederationRwandaSao Tome and PrincipeSenegalSerbiaSeychellesSierra LeoneSingaporeSlovak RepublicSloveniaSolomon IslandsSouth AfricaSouth AsiaSouth Asia (IDA & IBRD)SpainSri LankaSt. Kitts and NevisSt. LuciaSt. Vincent and the GrenadinesSub-Saharan Africa Sub-Saharan Africa (excluding high income)Sub-Saharan Africa (IDA & IBRD countries)SudanSurinameSwazilandSwedenSwitzerlandSyrian Arab RepublicTajikistanTanzaniaThailandTimor-LesteTongaTrinidad and TobagoTunisiaTurkeyTurkmenistanTuvaluUgandaUkraineUnited KingdomUnited StatesUruguayUzbekistanVanuatuVenezuela, RBVietnamWest Bank and GazaWorldYemen, Rep.ZambiaZimbabwe línea de tiempo (timeline):
En esta escala de tiempo se presenta un gráfico de 1981 y 2016 de Mozambique. Los datos de 1980 están ausentes. El número de observaciones reales por fecha: 36.
Fuente (nombre):
Indicadores del desarrollo mundial
Fuente (organización):
World Bank national accounts data, and OECD National Accounts data files.
Categorías:
Economy & Growth
Se ha actualizado:
23 abr 2017 año
Los indicadores de los cambios de valor en los últimos años
Mínimo:
1.975 bn
1 ene 1989 año
Máximo:
15.403 bn
1 ene 2015 año
A la fecha de observación
Valor
Cambio absoluto
El cambio con respecto al valor anterior
1 ene 1981 año
3.223 bn
+3.223 bn
0.0%
1 ene 1982 año
3.251 bn
+27.729 millones
0.86%
1 ene 1983 año
3.39 bn
+138.752 millones
4.27%
1 ene 1984 año
3.059 bn
-331.349 millones
-9.77%
1 ene 1985 año
3.246 bn
+186.882 millones
6.11%
1 ene 1986 año
4.471 bn
+1.225 bn
37.75%
1 ene 1987 año
5.329 bn
+857.679 millones
19.18%
1 ene 1988 año
2.257 bn
-3.072 bn
-57.64%
1 ene 1989 año
1.975 bn
-282.34 millones
-12.51%
1 ene 1990 año
2.134 bn
+159.398 millones
8.07%
1 ene 1991 año
2.308 bn
+174.072 millones
8.16%
1 ene 1992 año
3.188 bn
+880.336 millones
38.14%
1 ene 1993 año
2.226 bn
-962.278 millones
-30.18%
1 ene 1994 año
2.324 bn
+98.371 millones
4.42%
1 ene 1995 año
2.405 bn
+80.689 millones
3.47%
1 ene 1996 año
2.458 bn
+52.542 millones
2.18%
1 ene 1997 año
3.206 bn
+748.342 millones
30.45%
1 ene 1998 año
3.888 bn
+681.848 millones
21.27%
1 ene 1999 año
4.514 bn
+625.742 millones
16.09%
1 ene 2000 año
4.693 bn
+179.261 millones
3.97%
1 ene 2001 año
4.394 bn
-298.728 millones
-6.37%
1 ene 2002 año
4.273 bn
-120.788 millones
-2.75%
1 ene 2003 año
4.629 bn
+355.127 millones
8.31%
1 ene 2004 año
5.108 bn
+479.403 millones
10.36%
1 ene 2005 año
6.24 bn
+1.132 bn
22.16%
1 ene 2006 año
7.073 bn
+832.868 millones
13.35%
1 ene 2007 año
7.653 bn
+579.982 millones
8.2%
1 ene 2008 año
8.661 bn
+1.008 bn
13.17%
1 ene 2009 año
10.619 bn
+1.958 bn
22.61%
1 ene 2010 año
10.124 bn
-494.835 millones
-4.66%
1 ene 2011 año
9.405 bn
-719.385 millones
-7.11%
1 ene 2012 año
12.09 bn
+2.685 bn
28.55%
1 ene 2013 año
13.264 bn
+1.174 bn
9.71%
1 ene 2014 año
14.518 bn
+1.254 bn
9.46%
1 ene 2015 año
15.403 bn
+884.592 millones
6.09%
1 ene 2016 año
13.501 bn
-1.902 bn
-12.35%
Ranking de los países por los datos estadísticos actuales


Comentarios: