29
/es/
es
AIzaSyAYiBZKx7MnpbEhh9jyipgxe19OcubqV5w
April 1, 2024
54733
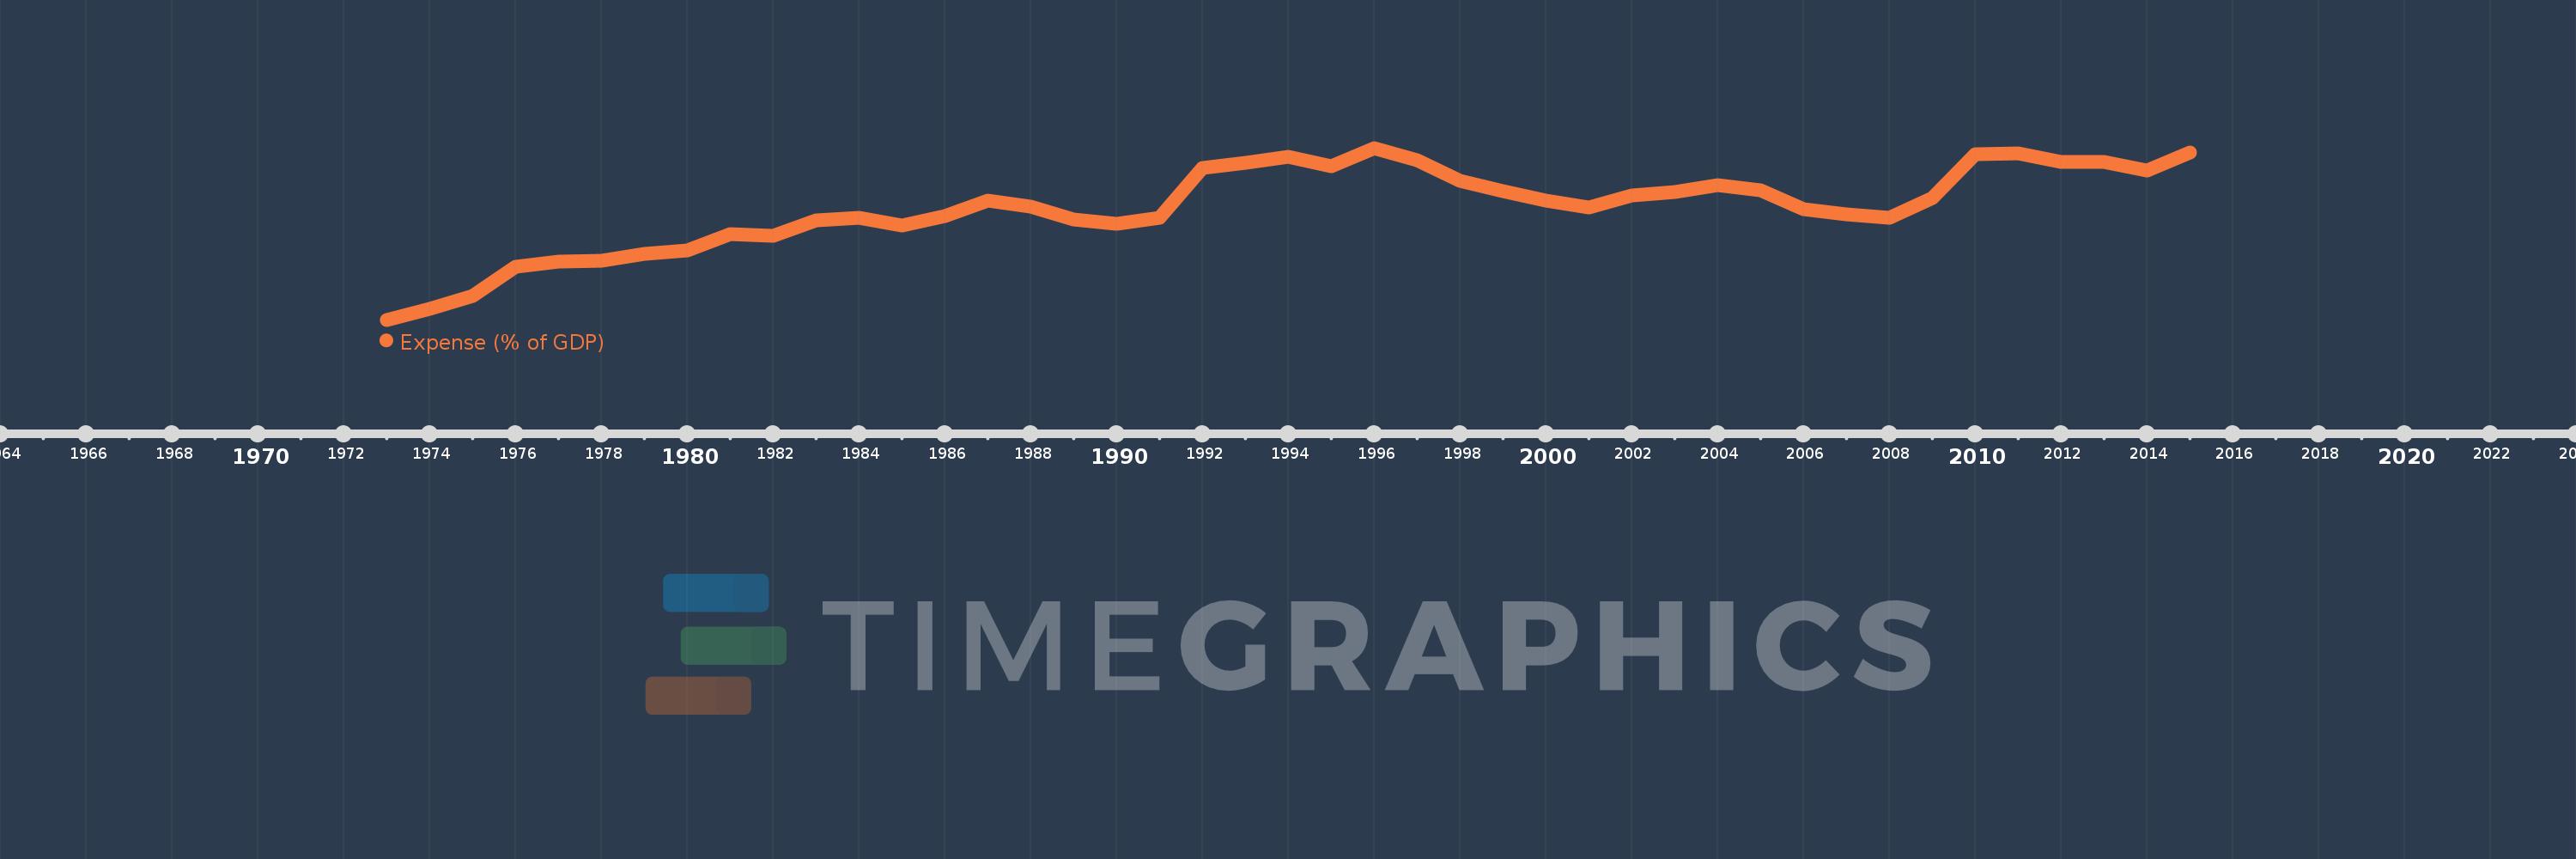
Post-demographic dividend
PST
false
2
1
Expense (% of GDP)
2015,2014,2013,2012,2011,2010,2009,2008,2007,2006,2005,2004,2003,2002,2001,2000,1999,1998,1997,1996,1995,1994,1993,1992,1991,1990,1989,1988,1987,1986,1985,1984,1983,1982,1981,1980,1979,1978,1977,1976,1975,1974,1973
Estas estadísticas en otros países:
AfghanistanAlbaniaAlgeriaAngolaAntigua and BarbudaArmeniaAustraliaAustriaAzerbaijanBahamas, TheBahrainBangladeshBarbadosBelarusBelgiumBelizeBeninBhutanBoliviaBosnia and HerzegovinaBotswanaBrazilBulgariaBurkina FasoBurundiCabo VerdeCambodiaCanadaCaribbean small statesCentral African RepublicCentral Europe and the BalticsChileColombiaCongo, Dem. Rep.Congo, Rep.Costa RicaCote d'IvoireCroatiaCyprusCzech RepublicDenmarkDominicaDominican RepublicEarly-demographic dividendEgypt, Arab Rep.El SalvadorEquatorial GuineaEstoniaEthiopiaEuro areaEurope & Central AsiaEurope & Central Asia (excluding high income)Europe & Central Asia (IDA & IBRD countries)European UnionFijiFinlandFranceGambia, TheGeorgiaGermanyGhanaGreeceGrenadaGuatemalaHeavily indebted poor countries (HIPC)High incomeHondurasHong Kong SAR, ChinaHungaryIcelandIDA blendIDA onlyIDA totalIndiaIndonesiaIran, Islamic Rep.IraqIrelandIsraelItalyJamaicaJapanJordanKazakhstanKenyaKiribatiKorea, Rep.KuwaitKyrgyz RepublicLao PDRLatin America & Caribbean Latin America & Caribbean (excluding high income)Latin America & the Caribbean (IDA & IBRD countries)LatviaLeast developed countries: UN classificationLebanonLesothoLiberiaLithuaniaLow incomeLower middle incomeLuxembourgMacao SAR, ChinaMacedonia, FYRMadagascarMalawiMalaysiaMaldivesMaliMaltaMauritiusMexicoMicronesia, Fed. Sts.Middle East & North Africa (excluding high income)Middle East & North Africa (IDA & IBRD countries)MoldovaMongoliaMoroccoMozambiqueMyanmarNamibiaNepalNetherlandsNew ZealandNicaraguaNigeriaNorth AmericaNorwayOECD membersOmanOther small statesPacific island small statesPakistanPanamaPapua New GuineaParaguayPeruPhilippinesPolandPortugalPost-demographic dividendPre-demographic dividendQatarRomaniaRussian FederationRwandaSamoaSan MarinoSao Tome and PrincipeSenegalSerbiaSeychellesSierra LeoneSingaporeSlovak RepublicSloveniaSmall statesSolomon IslandsSouth AfricaSouth AsiaSouth Asia (IDA & IBRD)SpainSri LankaSt. Kitts and NevisSt. LuciaSub-Saharan Africa Sub-Saharan Africa (excluding high income)Sub-Saharan Africa (IDA & IBRD countries)SurinameSwazilandSwedenSwitzerlandSyrian Arab RepublicTajikistanTanzaniaThailandTimor-LesteTogoTrinidad and TobagoTunisiaTurkeyUgandaUkraineUnited Arab EmiratesUnited KingdomUnited StatesUruguayVanuatuVenezuela, RBVietnamWest Bank and GazaWorldYemen, Rep.ZambiaZimbabwe línea de tiempo (timeline):
En esta escala de tiempo se presenta un gráfico de 1973 y 2015 de Post-demographic dividend. Los datos de 1972 están ausentes. El número de observaciones reales por fecha: 43.
Fuente (nombre):
Indicadores del desarrollo mundial
Fuente (organización):
International Monetary Fund, Government Finance Statistics Yearbook and data files, and World Bank and OECD GDP estimates.
Categorías:
Economy & Growth, Public Sector
Se ha actualizado:
23 abr 2017 año
Los indicadores de los cambios de valor en los últimos años
Mínimo:
18.846
1 ene 1973 año
Máximo:
30.206
1 ene 1996 año
A la fecha de observación
Valor
Cambio absoluto
El cambio con respecto al valor anterior
1 ene 1973 año
18.846
+18.846
0.0%
1 ene 1974 año
19.562
+0.717
3.8%
1 ene 1975 año
20.427
+0.864
4.42%
1 ene 1976 año
22.35
+1.923
9.42%
1 ene 1977 año
22.675
+0.324
1.45%
1 ene 1978 año
22.759
+0.085
0.37%
1 ene 1979 año
23.202
+0.443
1.94%
1 ene 1980 año
23.406
+0.204
0.88%
1 ene 1981 año
24.499
+1.092
4.67%
1 ene 1982 año
24.422
-0.076
-0.31%
1 ene 1983 año
25.439
+1.017
4.16%
1 ene 1984 año
25.61
+0.171
0.67%
1 ene 1985 año
25.061
-0.549
-2.14%
1 ene 1986 año
25.717
+0.656
2.62%
1 ene 1987 año
26.727
+1.01
3.93%
1 ene 1988 año
26.343
-0.384
-1.44%
1 ene 1989 año
25.497
-0.846
-3.21%
1 ene 1990 año
25.201
-0.297
-1.16%
1 ene 1991 año
25.584
+0.383
1.52%
1 ene 1992 año
28.9
+3.316
12.96%
1 ene 1993 año
29.246
+0.346
1.2%
1 ene 1994 año
29.625
+0.378
1.29%
1 ene 1995 año
28.981
-0.644
-2.17%
1 ene 1996 año
30.206
+1.225
4.23%
1 ene 1997 año
29.418
-0.788
-2.61%
1 ene 1998 año
28.038
-1.38
-4.69%
1 ene 1999 año
27.331
-0.707
-2.52%
1 ene 2000 año
26.748
-0.583
-2.13%
1 ene 2001 año
26.295
-0.453
-1.69%
1 ene 2002 año
27.04
+0.745
2.83%
1 ene 2003 año
27.293
+0.253
0.94%
1 ene 2004 año
27.758
+0.465
1.7%
1 ene 2005 año
27.412
-0.346
-1.25%
1 ene 2006 año
26.175
-1.236
-4.51%
1 ene 2007 año
25.815
-0.36
-1.38%
1 ene 2008 año
25.586
-0.229
-0.89%
1 ene 2009 año
26.9
+1.315
5.14%
1 ene 2010 año
29.797
+2.897
10.77%
1 ene 2011 año
29.824
+0.027
0.09%
1 ene 2012 año
29.289
-0.536
-1.8%
1 ene 2013 año
29.252
-0.037
-0.13%
1 ene 2014 año
28.706
-0.546
-1.87%
1 ene 2015 año
29.907
+1.201
4.18%
Ranking de los países por los datos estadísticos actuales


Comentarios: