29
/es/
es
AIzaSyAYiBZKx7MnpbEhh9jyipgxe19OcubqV5w
April 1, 2024
157212
Iran, Islamic Rep.
IRN
true
2
1
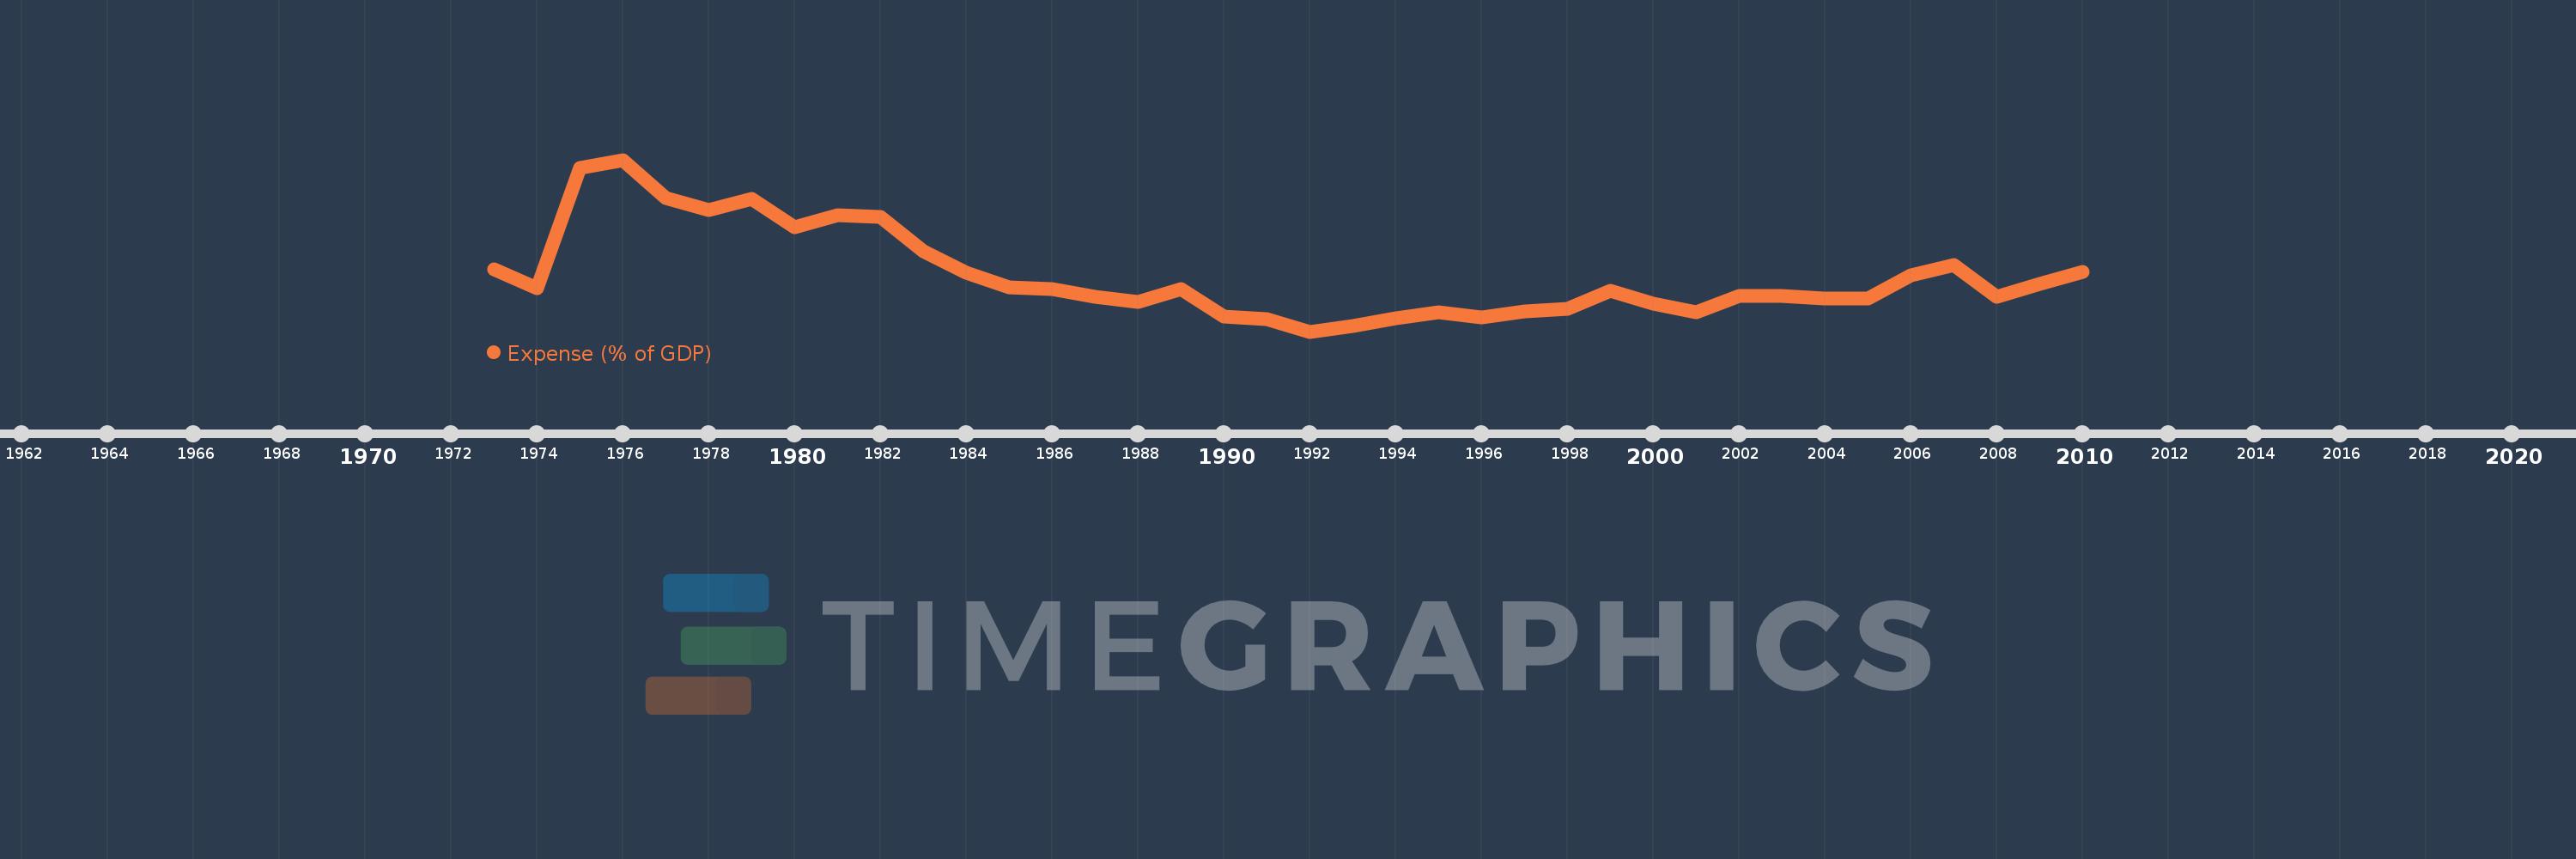
Expense (% of GDP)
2010,2009,2008,2007,2006,2005,2004,2003,2002,2001,2000,1999,1998,1997,1996,1995,1994,1993,1992,1991,1990,1989,1988,1987,1986,1985,1984,1983,1982,1981,1980,1979,1978,1977,1976,1975,1974,1973
Estas estadísticas en otros países:
AfghanistanAlbaniaAlgeriaAngolaAntigua and BarbudaArmeniaAustraliaAustriaAzerbaijanBahamas, TheBahrainBangladeshBarbadosBelarusBelgiumBelizeBeninBhutanBoliviaBosnia and HerzegovinaBotswanaBrazilBulgariaBurkina FasoBurundiCabo VerdeCambodiaCanadaCaribbean small statesCentral African RepublicCentral Europe and the BalticsChileColombiaCongo, Dem. Rep.Congo, Rep.Costa RicaCote d'IvoireCroatiaCyprusCzech RepublicDenmarkDominicaDominican RepublicEarly-demographic dividendEgypt, Arab Rep.El SalvadorEquatorial GuineaEstoniaEthiopiaEuro areaEurope & Central AsiaEurope & Central Asia (excluding high income)Europe & Central Asia (IDA & IBRD countries)European UnionFijiFinlandFranceGambia, TheGeorgiaGermanyGhanaGreeceGrenadaGuatemalaHeavily indebted poor countries (HIPC)High incomeHondurasHong Kong SAR, ChinaHungaryIcelandIDA blendIDA onlyIDA totalIndiaIndonesiaIran, Islamic Rep.IraqIrelandIsraelItalyJamaicaJapanJordanKazakhstanKenyaKiribatiKorea, Rep.KuwaitKyrgyz RepublicLao PDRLatin America & Caribbean Latin America & Caribbean (excluding high income)Latin America & the Caribbean (IDA & IBRD countries)LatviaLeast developed countries: UN classificationLebanonLesothoLiberiaLithuaniaLow incomeLower middle incomeLuxembourgMacao SAR, ChinaMacedonia, FYRMadagascarMalawiMalaysiaMaldivesMaliMaltaMauritiusMexicoMicronesia, Fed. Sts.Middle East & North Africa (excluding high income)Middle East & North Africa (IDA & IBRD countries)MoldovaMongoliaMoroccoMozambiqueMyanmarNamibiaNepalNetherlandsNew ZealandNicaraguaNigeriaNorth AmericaNorwayOECD membersOmanOther small statesPacific island small statesPakistanPanamaPapua New GuineaParaguayPeruPhilippinesPolandPortugalPost-demographic dividendPre-demographic dividendQatarRomaniaRussian FederationRwandaSamoaSan MarinoSao Tome and PrincipeSenegalSerbiaSeychellesSierra LeoneSingaporeSlovak RepublicSloveniaSmall statesSolomon IslandsSouth AfricaSouth AsiaSouth Asia (IDA & IBRD)SpainSri LankaSt. Kitts and NevisSt. LuciaSub-Saharan Africa Sub-Saharan Africa (excluding high income)Sub-Saharan Africa (IDA & IBRD countries)SurinameSwazilandSwedenSwitzerlandSyrian Arab RepublicTajikistanTanzaniaThailandTimor-LesteTogoTrinidad and TobagoTunisiaTurkeyUgandaUkraineUnited Arab EmiratesUnited KingdomUnited StatesUruguayVanuatuVenezuela, RBVietnamWest Bank and GazaWorldYemen, Rep.ZambiaZimbabwe línea de tiempo (timeline):
En esta escala de tiempo se presenta un gráfico de 1973 y 2010 de Iran, Islamic Rep.. Los datos de 1972 están ausentes. El número de observaciones reales por fecha: 38.
Fuente (nombre):
Indicadores del desarrollo mundial
Fuente (organización):
International Monetary Fund, Government Finance Statistics Yearbook and data files, and World Bank and OECD GDP estimates.
Categorías:
Economy & Growth, Public Sector
Se ha actualizado:
23 abr 2017 año
Los indicadores de los cambios de valor en los últimos años
Mínimo:
13.204
1 ene 1992 año
Máximo:
34.071
1 ene 1976 año
A la fecha de observación
Valor
Cambio absoluto
El cambio con respecto al valor anterior
1 ene 1973 año
20.764
+20.764
0.0%
1 ene 1974 año
18.473
-2.291
-11.03%
1 ene 1975 año
33.073
+14.6
79.04%
1 ene 1976 año
34.071
+0.998
3.02%
1 ene 1977 año
29.421
-4.65
-13.65%
1 ene 1978 año
27.963
-1.459
-4.96%
1 ene 1979 año
29.278
+1.315
4.7%
1 ene 1980 año
25.896
-3.381
-11.55%
1 ene 1981 año
27.356
+1.459
5.63%
1 ene 1982 año
27.179
-0.177
-0.65%
1 ene 1983 año
23.0
-4.179
-15.38%
1 ene 1984 año
20.319
-2.681
-11.66%
1 ene 1985 año
18.546
-1.773
-8.72%
1 ene 1986 año
18.342
-0.204
-1.1%
1 ene 1987 año
17.443
-0.899
-4.9%
1 ene 1988 año
16.816
-0.626
-3.59%
1 ene 1989 año
18.349
+1.533
9.12%
1 ene 1990 año
14.996
-3.353
-18.28%
1 ene 1991 año
14.667
-0.329
-2.19%
1 ene 1992 año
13.204
-1.463
-9.97%
1 ene 1993 año
13.892
+0.688
5.21%
1 ene 1994 año
14.831
+0.939
6.76%
1 ene 1995 año
15.538
+0.707
4.77%
1 ene 1996 año
14.877
-0.661
-4.26%
1 ene 1997 año
15.61
+0.733
4.93%
1 ene 1998 año
15.921
+0.311
1.99%
1 ene 1999 año
18.168
+2.247
14.11%
1 ene 2000 año
16.581
-1.587
-8.74%
1 ene 2001 año
15.591
-0.99
-5.97%
1 ene 2002 año
17.546
+1.956
12.54%
1 ene 2003 año
17.486
-0.06
-0.34%
1 ene 2004 año
17.176
-0.31
-1.77%
1 ene 2005 año
17.228
+0.053
0.31%
1 ene 2006 año
20.004
+2.776
16.11%
1 ene 2007 año
21.331
+1.327
6.63%
1 ene 2008 año
17.444
-3.887
-18.22%
1 ene 2009 año
18.947
+1.503
8.61%
1 ene 2010 año
20.495
+1.548
8.17%
Ranking de los países por los datos estadísticos actuales


Comentarios: