29
/es/
es
AIzaSyAYiBZKx7MnpbEhh9jyipgxe19OcubqV5w
April 1, 2024
160420
Israel
ISR
true
2
1
Expense (% of GDP)
2016,2015,2014,2013,2012,2011,2010,2009,2008,2007,2006,2005,2004,2003,2002,2001,2000,1999,1998,1997,1996,1995,1994,1993,1992,1991,1990,1989,1988,1987,1986,1985,1984,1983,1982,1981,1980,1979,1978,1977,1976,1975,1974,1973
Estas estadísticas en otros países:
AfghanistanAlbaniaAlgeriaAngolaAntigua and BarbudaArmeniaAustraliaAustriaAzerbaijanBahamas, TheBahrainBangladeshBarbadosBelarusBelgiumBelizeBeninBhutanBoliviaBosnia and HerzegovinaBotswanaBrazilBulgariaBurkina FasoBurundiCabo VerdeCambodiaCanadaCaribbean small statesCentral African RepublicCentral Europe and the BalticsChileColombiaCongo, Dem. Rep.Congo, Rep.Costa RicaCote d'IvoireCroatiaCyprusCzech RepublicDenmarkDominicaDominican RepublicEarly-demographic dividendEgypt, Arab Rep.El SalvadorEquatorial GuineaEstoniaEthiopiaEuro areaEurope & Central AsiaEurope & Central Asia (excluding high income)Europe & Central Asia (IDA & IBRD countries)European UnionFijiFinlandFranceGambia, TheGeorgiaGermanyGhanaGreeceGrenadaGuatemalaHeavily indebted poor countries (HIPC)High incomeHondurasHong Kong SAR, ChinaHungaryIcelandIDA blendIDA onlyIDA totalIndiaIndonesiaIran, Islamic Rep.IraqIrelandIsraelItalyJamaicaJapanJordanKazakhstanKenyaKiribatiKorea, Rep.KuwaitKyrgyz RepublicLao PDRLatin America & Caribbean Latin America & Caribbean (excluding high income)Latin America & the Caribbean (IDA & IBRD countries)LatviaLeast developed countries: UN classificationLebanonLesothoLiberiaLithuaniaLow incomeLower middle incomeLuxembourgMacao SAR, ChinaMacedonia, FYRMadagascarMalawiMalaysiaMaldivesMaliMaltaMauritiusMexicoMicronesia, Fed. Sts.Middle East & North Africa (excluding high income)Middle East & North Africa (IDA & IBRD countries)MoldovaMongoliaMoroccoMozambiqueMyanmarNamibiaNepalNetherlandsNew ZealandNicaraguaNigeriaNorth AmericaNorwayOECD membersOmanOther small statesPacific island small statesPakistanPanamaPapua New GuineaParaguayPeruPhilippinesPolandPortugalPost-demographic dividendPre-demographic dividendQatarRomaniaRussian FederationRwandaSamoaSan MarinoSao Tome and PrincipeSenegalSerbiaSeychellesSierra LeoneSingaporeSlovak RepublicSloveniaSmall statesSolomon IslandsSouth AfricaSouth AsiaSouth Asia (IDA & IBRD)SpainSri LankaSt. Kitts and NevisSt. LuciaSub-Saharan Africa Sub-Saharan Africa (excluding high income)Sub-Saharan Africa (IDA & IBRD countries)SurinameSwazilandSwedenSwitzerlandSyrian Arab RepublicTajikistanTanzaniaThailandTimor-LesteTogoTrinidad and TobagoTunisiaTurkeyUgandaUkraineUnited Arab EmiratesUnited KingdomUnited StatesUruguayVanuatuVenezuela, RBVietnamWest Bank and GazaWorldYemen, Rep.ZambiaZimbabwe línea de tiempo (timeline):
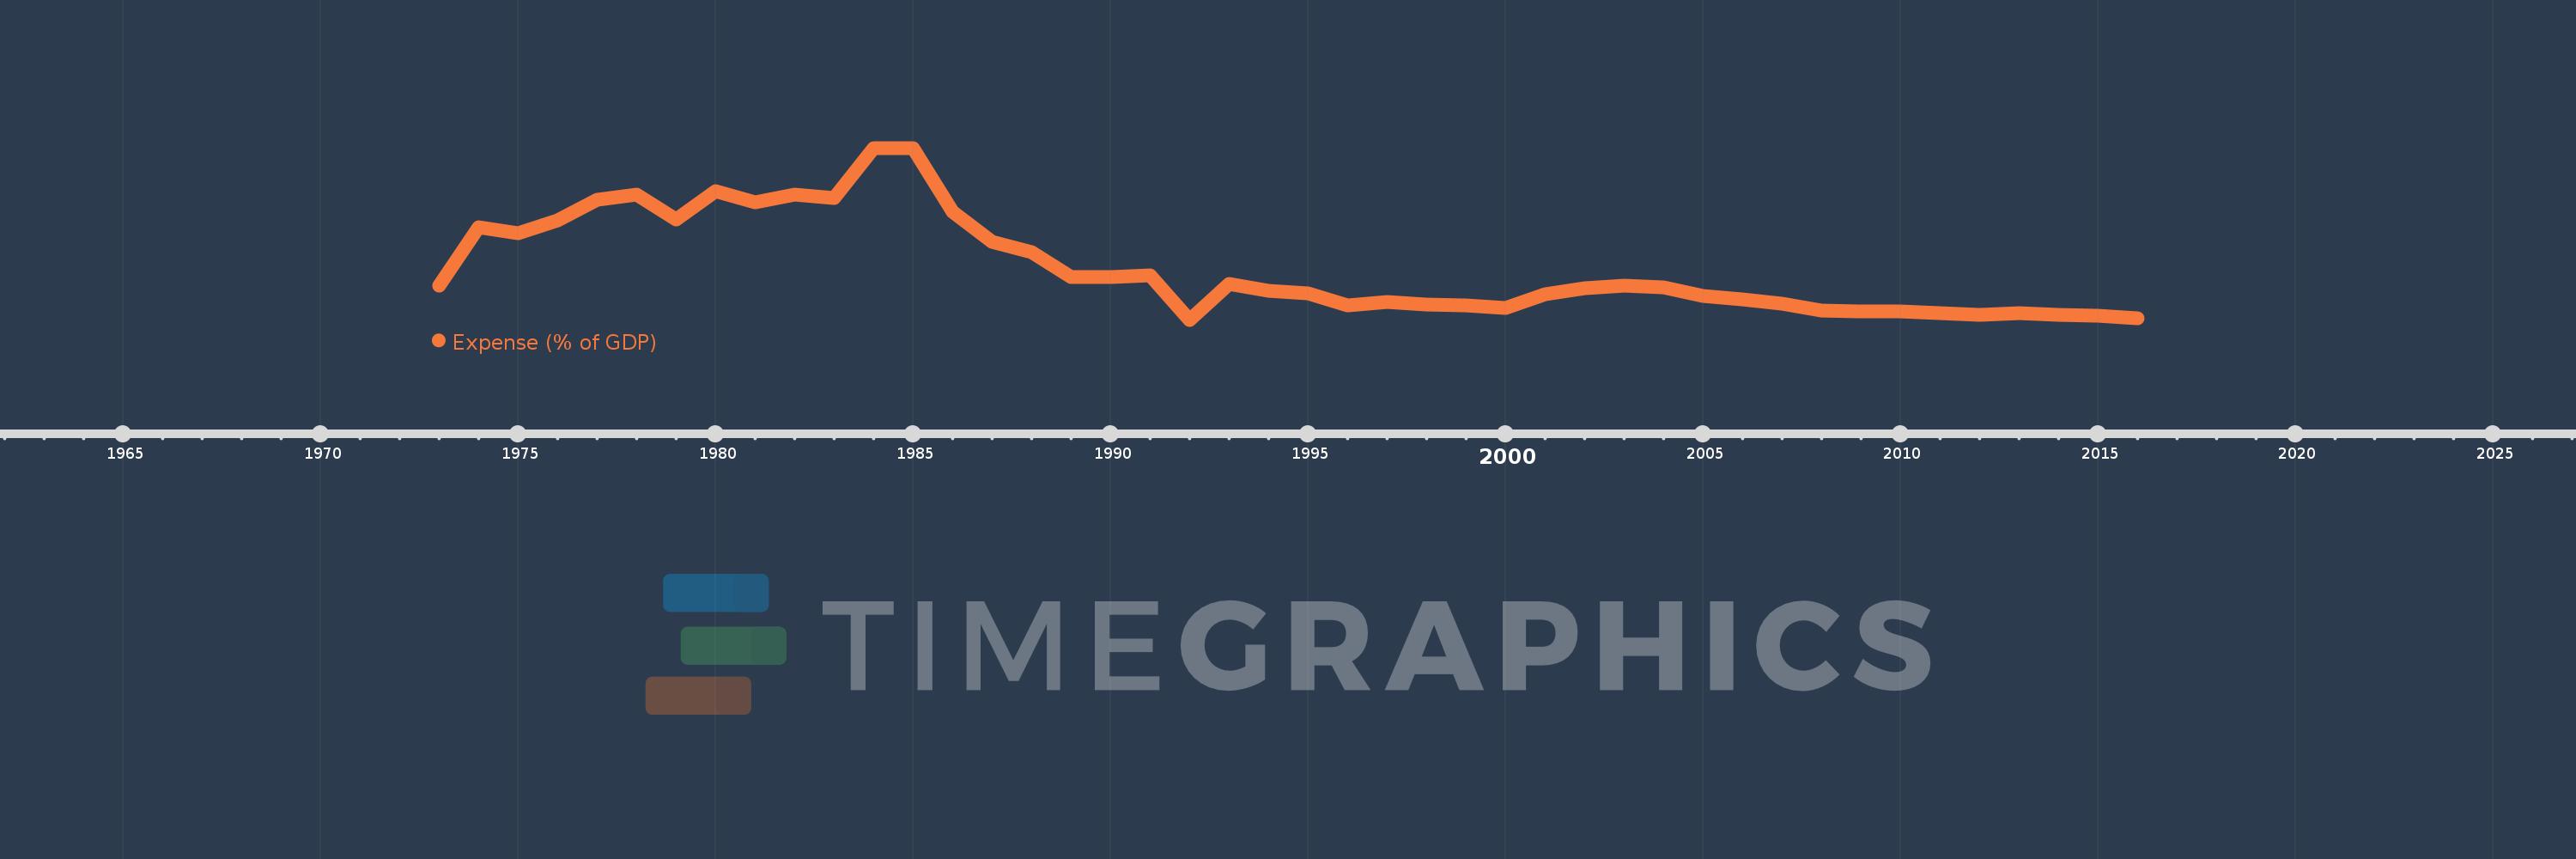
En esta escala de tiempo se presenta un gráfico de 1973 y 2016 de Israel. Los datos de 1972 están ausentes. El número de observaciones reales por fecha: 44.
Fuente (nombre):
Indicadores del desarrollo mundial
Fuente (organización):
International Monetary Fund, Government Finance Statistics Yearbook and data files, and World Bank and OECD GDP estimates.
Categorías:
Economy & Growth, Public Sector
Se ha actualizado:
23 abr 2017 año
Los indicadores de los cambios de valor en los últimos años
Mínimo:
36.323
1 ene 1992 año
Máximo:
88.608
1 ene 1985 año
A la fecha de observación
Valor
Cambio absoluto
El cambio con respecto al valor anterior
1 ene 1973 año
46.69
+46.69
0.0%
1 ene 1974 año
64.486
+17.796
38.12%
1 ene 1975 año
62.561
-1.925
-2.98%
1 ene 1976 año
66.523
+3.961
6.33%
1 ene 1977 año
72.816
+6.294
9.46%
1 ene 1978 año
74.357
+1.541
2.12%
1 ene 1979 año
66.961
-7.396
-9.95%
1 ene 1980 año
75.523
+8.561
12.79%
1 ene 1981 año
72.035
-3.487
-4.62%
1 ene 1982 año
74.374
+2.338
3.25%
1 ene 1983 año
73.486
-0.888
-1.19%
1 ene 1984 año
88.415
+14.929
20.32%
1 ene 1985 año
88.608
+0.193
0.22%
1 ene 1986 año
69.286
-19.321
-21.81%
1 ene 1987 año
60.035
-9.251
-13.35%
1 ene 1988 año
56.989
-3.046
-5.07%
1 ene 1989 año
49.446
-7.543
-13.24%
1 ene 1990 año
49.376
-0.07
-0.14%
1 ene 1991 año
49.803
+0.427
0.86%
1 ene 1992 año
36.323
-13.481
-27.07%
1 ene 1993 año
47.166
+10.843
29.85%
1 ene 1994 año
45.254
-1.912
-4.05%
1 ene 1995 año
44.459
-0.795
-1.76%
1 ene 1996 año
40.746
-3.713
-8.35%
1 ene 1997 año
41.749
+1.003
2.46%
1 ene 1998 año
41.011
-0.737
-1.77%
1 ene 1999 año
40.719
-0.292
-0.71%
1 ene 2000 año
40.029
-0.69
-1.69%
1 ene 2001 año
44.213
+4.184
10.45%
1 ene 2002 año
46.048
+1.835
4.15%
1 ene 2003 año
46.764
+0.716
1.56%
1 ene 2004 año
46.122
-0.642
-1.37%
1 ene 2005 año
43.441
-2.681
-5.81%
1 ene 2006 año
42.546
-0.895
-2.06%
1 ene 2007 año
41.177
-1.369
-3.22%
1 ene 2008 año
39.162
-2.016
-4.9%
1 ene 2009 año
38.78
-0.382
-0.97%
1 ene 2010 año
38.849
+0.07
0.18%
1 ene 2011 año
38.255
-0.595
-1.53%
1 ene 2012 año
37.763
-0.492
-1.29%
1 ene 2013 año
38.331
+0.568
1.5%
1 ene 2014 año
37.871
-0.46
-1.2%
1 ene 2015 año
37.429
-0.442
-1.17%
1 ene 2016 año
36.81
-0.619
-1.65%
Ranking de los países por los datos estadísticos actuales


Comentarios: