29
/es/
es
AIzaSyAYiBZKx7MnpbEhh9jyipgxe19OcubqV5w
April 1, 2024
139203
Germany
DEU
true
2
1
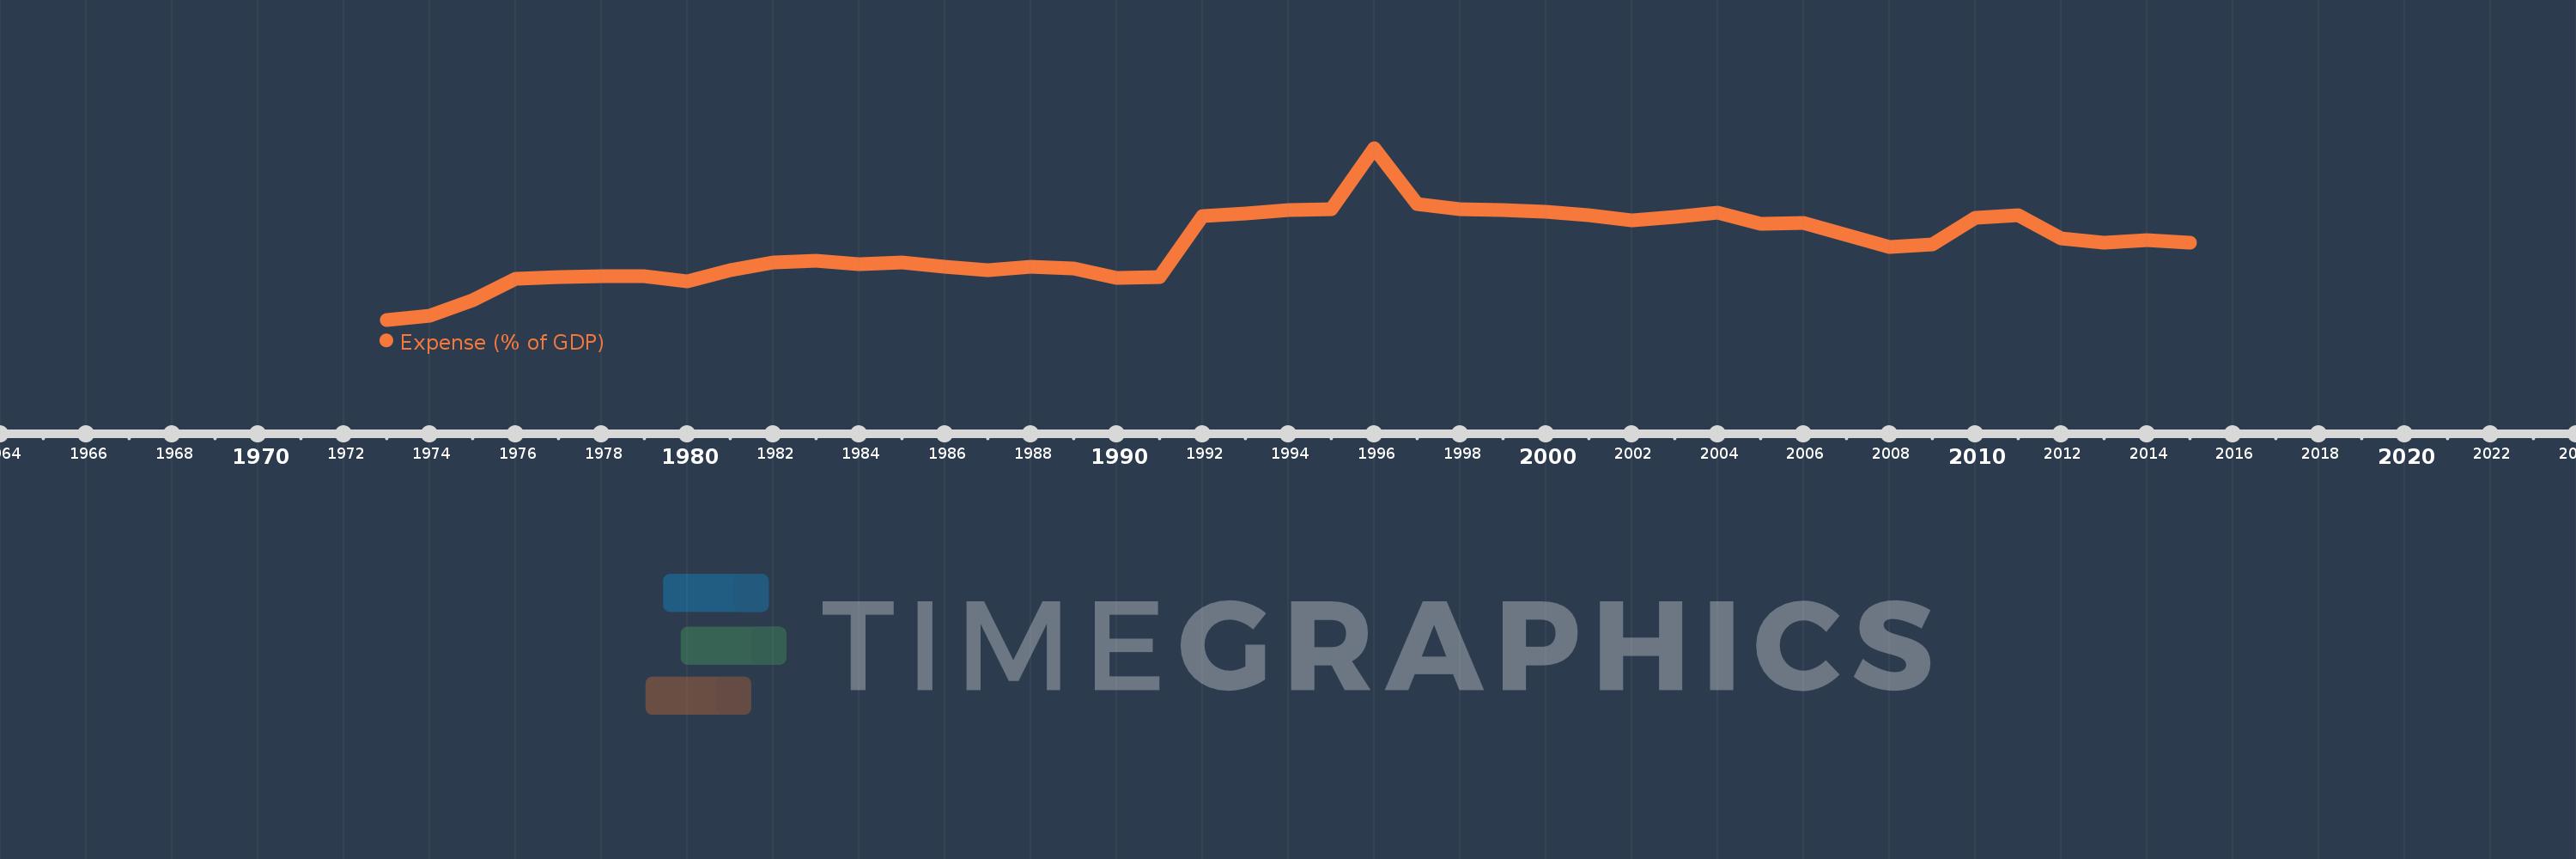
Expense (% of GDP)
2015,2014,2013,2012,2011,2010,2009,2008,2007,2006,2005,2004,2003,2002,2001,2000,1999,1998,1997,1996,1995,1994,1993,1992,1991,1990,1989,1988,1987,1986,1985,1984,1983,1982,1981,1980,1979,1978,1977,1976,1975,1974,1973
Estas estadísticas en otros países:
AfghanistanAlbaniaAlgeriaAngolaAntigua and BarbudaArmeniaAustraliaAustriaAzerbaijanBahamas, TheBahrainBangladeshBarbadosBelarusBelgiumBelizeBeninBhutanBoliviaBosnia and HerzegovinaBotswanaBrazilBulgariaBurkina FasoBurundiCabo VerdeCambodiaCanadaCaribbean small statesCentral African RepublicCentral Europe and the BalticsChileColombiaCongo, Dem. Rep.Congo, Rep.Costa RicaCote d'IvoireCroatiaCyprusCzech RepublicDenmarkDominicaDominican RepublicEarly-demographic dividendEgypt, Arab Rep.El SalvadorEquatorial GuineaEstoniaEthiopiaEuro areaEurope & Central AsiaEurope & Central Asia (excluding high income)Europe & Central Asia (IDA & IBRD countries)European UnionFijiFinlandFranceGambia, TheGeorgiaGermanyGhanaGreeceGrenadaGuatemalaHeavily indebted poor countries (HIPC)High incomeHondurasHong Kong SAR, ChinaHungaryIcelandIDA blendIDA onlyIDA totalIndiaIndonesiaIran, Islamic Rep.IraqIrelandIsraelItalyJamaicaJapanJordanKazakhstanKenyaKiribatiKorea, Rep.KuwaitKyrgyz RepublicLao PDRLatin America & Caribbean Latin America & Caribbean (excluding high income)Latin America & the Caribbean (IDA & IBRD countries)LatviaLeast developed countries: UN classificationLebanonLesothoLiberiaLithuaniaLow incomeLower middle incomeLuxembourgMacao SAR, ChinaMacedonia, FYRMadagascarMalawiMalaysiaMaldivesMaliMaltaMauritiusMexicoMicronesia, Fed. Sts.Middle East & North Africa (excluding high income)Middle East & North Africa (IDA & IBRD countries)MoldovaMongoliaMoroccoMozambiqueMyanmarNamibiaNepalNetherlandsNew ZealandNicaraguaNigeriaNorth AmericaNorwayOECD membersOmanOther small statesPacific island small statesPakistanPanamaPapua New GuineaParaguayPeruPhilippinesPolandPortugalPost-demographic dividendPre-demographic dividendQatarRomaniaRussian FederationRwandaSamoaSan MarinoSao Tome and PrincipeSenegalSerbiaSeychellesSierra LeoneSingaporeSlovak RepublicSloveniaSmall statesSolomon IslandsSouth AfricaSouth AsiaSouth Asia (IDA & IBRD)SpainSri LankaSt. Kitts and NevisSt. LuciaSub-Saharan Africa Sub-Saharan Africa (excluding high income)Sub-Saharan Africa (IDA & IBRD countries)SurinameSwazilandSwedenSwitzerlandSyrian Arab RepublicTajikistanTanzaniaThailandTimor-LesteTogoTrinidad and TobagoTunisiaTurkeyUgandaUkraineUnited Arab EmiratesUnited KingdomUnited StatesUruguayVanuatuVenezuela, RBVietnamWest Bank and GazaWorldYemen, Rep.ZambiaZimbabwe línea de tiempo (timeline):
En esta escala de tiempo se presenta un gráfico de 1973 y 2015 de Germany. Los datos de 1972 están ausentes. El número de observaciones reales por fecha: 43.
Fuente (nombre):
Indicadores del desarrollo mundial
Fuente (organización):
International Monetary Fund, Government Finance Statistics Yearbook and data files, and World Bank and OECD GDP estimates.
Categorías:
Economy & Growth, Public Sector
Se ha actualizado:
23 abr 2017 año
Los indicadores de los cambios de valor en los últimos años
Mínimo:
20.245
1 ene 1973 año
Máximo:
38.392
1 ene 1996 año
A la fecha de observación
Valor
Cambio absoluto
El cambio con respecto al valor anterior
1 ene 1973 año
20.245
+20.245
0.0%
1 ene 1974 año
20.664
+0.419
2.07%
1 ene 1975 año
22.278
+1.614
7.81%
1 ene 1976 año
24.575
+2.297
10.31%
1 ene 1977 año
24.735
+0.16
0.65%
1 ene 1978 año
24.811
+0.076
0.31%
1 ene 1979 año
24.8
-0.011
-0.04%
1 ene 1980 año
24.345
-0.456
-1.84%
1 ene 1981 año
25.481
+1.136
4.67%
1 ene 1982 año
26.27
+0.789
3.1%
1 ene 1983 año
26.512
+0.242
0.92%
1 ene 1984 año
26.091
-0.421
-1.59%
1 ene 1985 año
26.296
+0.205
0.78%
1 ene 1986 año
25.863
-0.433
-1.65%
1 ene 1987 año
25.442
-0.422
-1.63%
1 ene 1988 año
25.855
+0.413
1.62%
1 ene 1989 año
25.643
-0.212
-0.82%
1 ene 1990 año
24.651
-0.992
-3.87%
1 ene 1991 año
24.779
+0.129
0.52%
1 ene 1992 año
31.204
+6.424
25.93%
1 ene 1993 año
31.431
+0.227
0.73%
1 ene 1994 año
31.849
+0.418
1.33%
1 ene 1995 año
31.881
+0.032
0.1%
1 ene 1996 año
38.392
+6.512
20.43%
1 ene 1997 año
32.502
-5.89
-15.34%
1 ene 1998 año
31.93
-0.572
-1.76%
1 ene 1999 año
31.791
-0.14
-0.44%
1 ene 2000 año
31.667
-0.124
-0.39%
1 ene 2001 año
31.318
-0.349
-1.1%
1 ene 2002 año
30.765
-0.553
-1.77%
1 ene 2003 año
31.137
+0.372
1.21%
1 ene 2004 año
31.582
+0.445
1.43%
1 ene 2005 año
30.407
-1.175
-3.72%
1 ene 2006 año
30.45
+0.043
0.14%
1 ene 2007 año
29.219
-1.231
-4.04%
1 ene 2008 año
27.97
-1.25
-4.28%
1 ene 2009 año
28.23
+0.26
0.93%
1 ene 2010 año
30.995
+2.764
9.79%
1 ene 2011 año
31.256
+0.262
0.84%
1 ene 2012 año
28.862
-2.395
-7.66%
1 ene 2013 año
28.423
-0.439
-1.52%
1 ene 2014 año
28.611
+0.189
0.66%
1 ene 2015 año
28.341
-0.271
-0.95%
Ranking de los países por los datos estadísticos actuales


Comentarios: