29
/es/
es
AIzaSyAYiBZKx7MnpbEhh9jyipgxe19OcubqV5w
April 1, 2024
104802
Chile
CHL
true
2
1
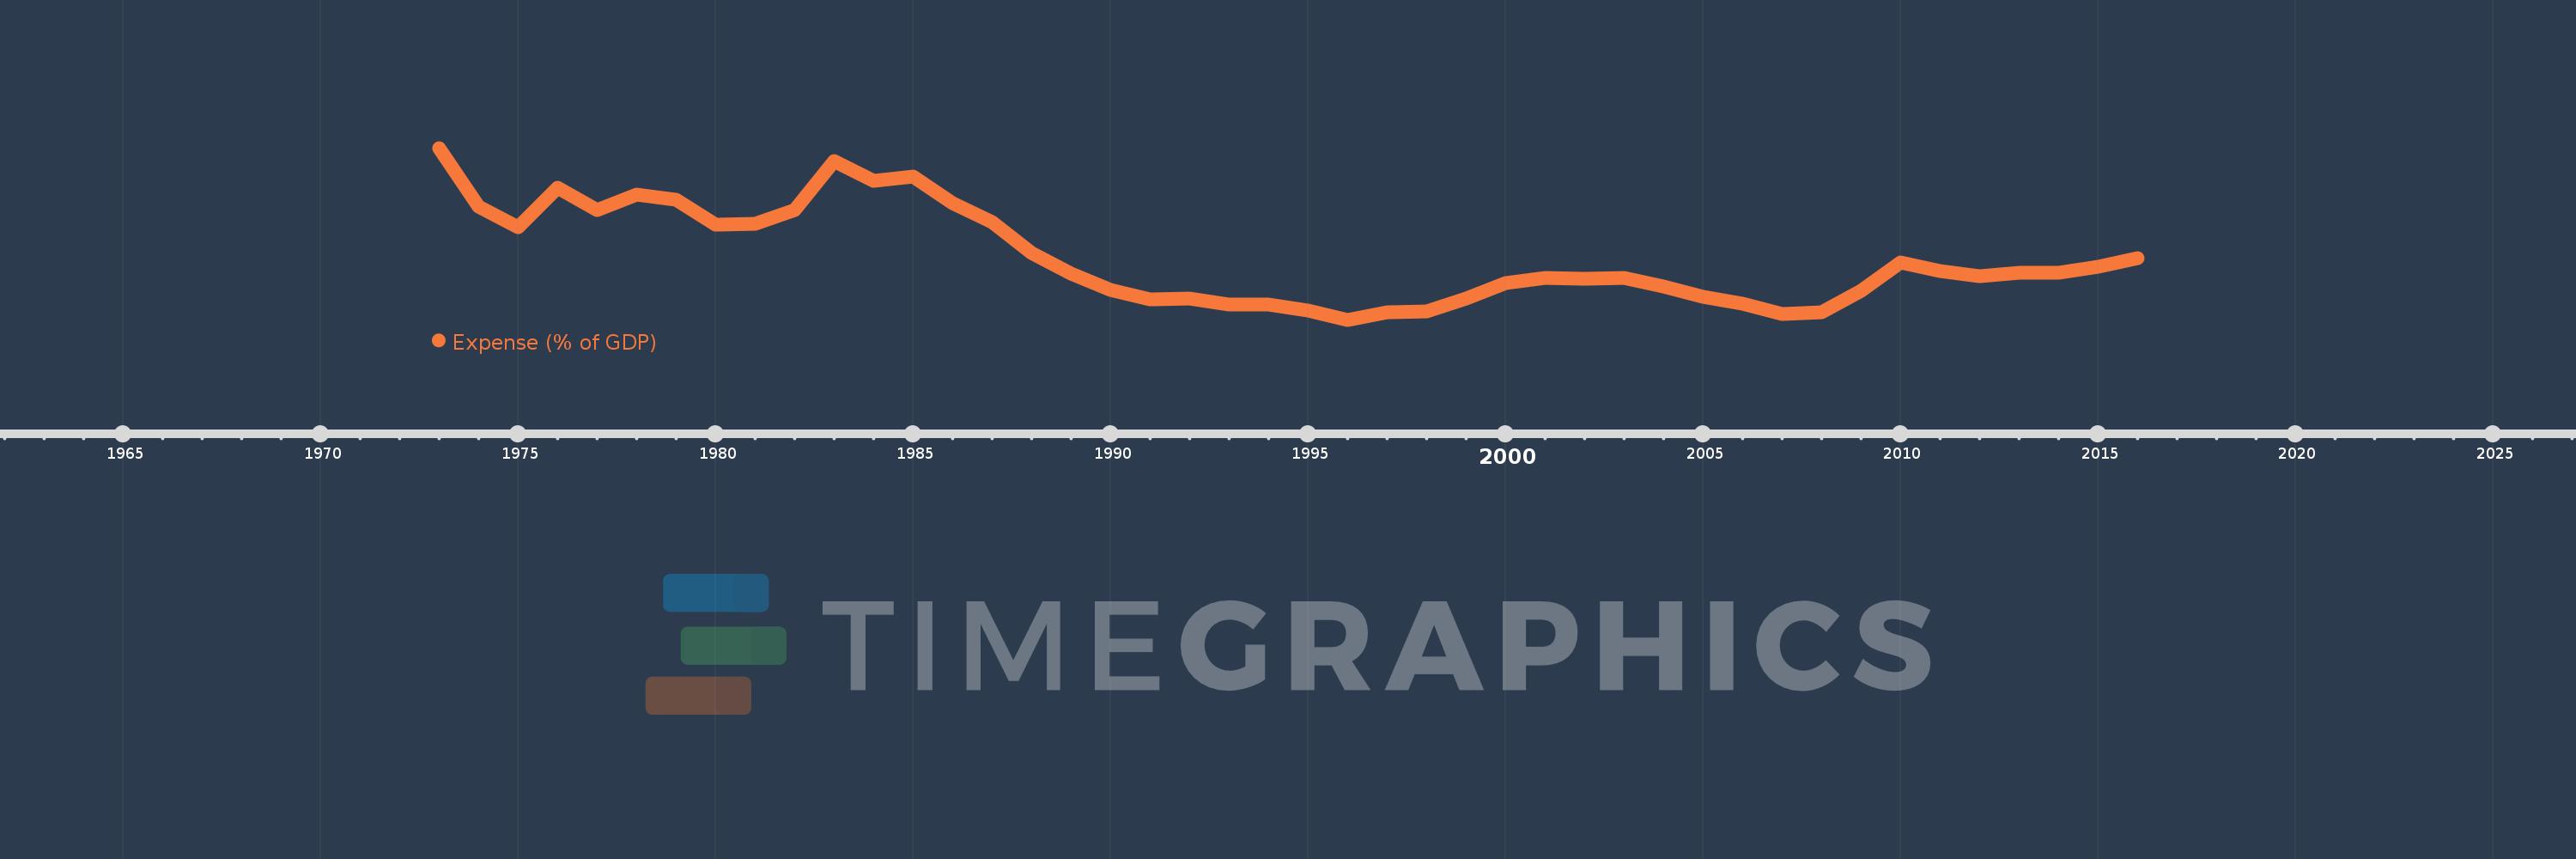
Expense (% of GDP)
2016,2015,2014,2013,2012,2011,2010,2009,2008,2007,2006,2005,2004,2003,2002,2001,2000,1999,1998,1997,1996,1995,1994,1993,1992,1991,1990,1989,1988,1987,1986,1985,1984,1983,1982,1981,1980,1979,1978,1977,1976,1975,1974,1973
Estas estadísticas en otros países:
AfghanistanAlbaniaAlgeriaAngolaAntigua and BarbudaArmeniaAustraliaAustriaAzerbaijanBahamas, TheBahrainBangladeshBarbadosBelarusBelgiumBelizeBeninBhutanBoliviaBosnia and HerzegovinaBotswanaBrazilBulgariaBurkina FasoBurundiCabo VerdeCambodiaCanadaCaribbean small statesCentral African RepublicCentral Europe and the BalticsChileColombiaCongo, Dem. Rep.Congo, Rep.Costa RicaCote d'IvoireCroatiaCyprusCzech RepublicDenmarkDominicaDominican RepublicEarly-demographic dividendEgypt, Arab Rep.El SalvadorEquatorial GuineaEstoniaEthiopiaEuro areaEurope & Central AsiaEurope & Central Asia (excluding high income)Europe & Central Asia (IDA & IBRD countries)European UnionFijiFinlandFranceGambia, TheGeorgiaGermanyGhanaGreeceGrenadaGuatemalaHeavily indebted poor countries (HIPC)High incomeHondurasHong Kong SAR, ChinaHungaryIcelandIDA blendIDA onlyIDA totalIndiaIndonesiaIran, Islamic Rep.IraqIrelandIsraelItalyJamaicaJapanJordanKazakhstanKenyaKiribatiKorea, Rep.KuwaitKyrgyz RepublicLao PDRLatin America & Caribbean Latin America & Caribbean (excluding high income)Latin America & the Caribbean (IDA & IBRD countries)LatviaLeast developed countries: UN classificationLebanonLesothoLiberiaLithuaniaLow incomeLower middle incomeLuxembourgMacao SAR, ChinaMacedonia, FYRMadagascarMalawiMalaysiaMaldivesMaliMaltaMauritiusMexicoMicronesia, Fed. Sts.Middle East & North Africa (excluding high income)Middle East & North Africa (IDA & IBRD countries)MoldovaMongoliaMoroccoMozambiqueMyanmarNamibiaNepalNetherlandsNew ZealandNicaraguaNigeriaNorth AmericaNorwayOECD membersOmanOther small statesPacific island small statesPakistanPanamaPapua New GuineaParaguayPeruPhilippinesPolandPortugalPost-demographic dividendPre-demographic dividendQatarRomaniaRussian FederationRwandaSamoaSan MarinoSao Tome and PrincipeSenegalSerbiaSeychellesSierra LeoneSingaporeSlovak RepublicSloveniaSmall statesSolomon IslandsSouth AfricaSouth AsiaSouth Asia (IDA & IBRD)SpainSri LankaSt. Kitts and NevisSt. LuciaSub-Saharan Africa Sub-Saharan Africa (excluding high income)Sub-Saharan Africa (IDA & IBRD countries)SurinameSwazilandSwedenSwitzerlandSyrian Arab RepublicTajikistanTanzaniaThailandTimor-LesteTogoTrinidad and TobagoTunisiaTurkeyUgandaUkraineUnited Arab EmiratesUnited KingdomUnited StatesUruguayVanuatuVenezuela, RBVietnamWest Bank and GazaWorldYemen, Rep.ZambiaZimbabwe línea de tiempo (timeline):
En esta escala de tiempo se presenta un gráfico de 1973 y 2016 de Chile. Los datos de 1972 están ausentes. El número de observaciones reales por fecha: 44.
Fuente (nombre):
Indicadores del desarrollo mundial
Fuente (organización):
International Monetary Fund, Government Finance Statistics Yearbook and data files, and World Bank and OECD GDP estimates.
Categorías:
Economy & Growth, Public Sector
Se ha actualizado:
23 abr 2017 año
Los indicadores de los cambios de valor en los últimos años
Mínimo:
15.569
1 ene 1996 año
Máximo:
33.294
1 ene 1973 año
A la fecha de observación
Valor
Cambio absoluto
El cambio con respecto al valor anterior
1 ene 1973 año
33.294
+33.294
0.0%
1 ene 1974 año
27.257
-6.038
-18.13%
1 ene 1975 año
25.082
-2.175
-7.98%
1 ene 1976 año
29.226
+4.144
16.52%
1 ene 1977 año
26.928
-2.298
-7.86%
1 ene 1978 año
28.441
+1.513
5.62%
1 ene 1979 año
27.993
-0.448
-1.57%
1 ene 1980 año
25.384
-2.609
-9.32%
1 ene 1981 año
25.495
+0.111
0.44%
1 ene 1982 año
26.906
+1.412
5.54%
1 ene 1983 año
31.974
+5.068
18.83%
1 ene 1984 año
29.929
-2.045
-6.4%
1 ene 1985 año
30.319
+0.39
1.3%
1 ene 1986 año
27.638
-2.681
-8.84%
1 ene 1987 año
25.623
-2.015
-7.29%
1 ene 1988 año
22.456
-3.167
-12.36%
1 ene 1989 año
20.344
-2.112
-9.4%
1 ene 1990 año
18.646
-1.698
-8.35%
1 ene 1991 año
17.649
-0.996
-5.34%
1 ene 1992 año
17.791
+0.142
0.8%
1 ene 1993 año
17.152
-0.639
-3.59%
1 ene 1994 año
17.156
+0.004
0.02%
1 ene 1995 año
16.519
-0.637
-3.72%
1 ene 1996 año
15.569
-0.95
-5.75%
1 ene 1997 año
16.321
+0.752
4.83%
1 ene 1998 año
16.424
+0.103
0.63%
1 ene 1999 año
17.795
+1.371
8.35%
1 ene 2000 año
19.381
+1.585
8.91%
1 ene 2001 año
19.865
+0.484
2.5%
1 ene 2002 año
19.83
-0.035
-0.18%
1 ene 2003 año
19.897
+0.068
0.34%
1 ene 2004 año
19.006
-0.892
-4.48%
1 ene 2005 año
17.928
-1.078
-5.67%
1 ene 2006 año
17.251
-0.677
-3.78%
1 ene 2007 año
16.129
-1.121
-6.5%
1 ene 2008 año
16.366
+0.236
1.47%
1 ene 2009 año
18.563
+2.197
13.42%
1 ene 2010 año
21.464
+2.902
15.63%
1 ene 2011 año
20.598
-0.867
-4.04%
1 ene 2012 año
20.027
-0.571
-2.77%
1 ene 2013 año
20.409
+0.382
1.91%
1 ene 2014 año
20.452
+0.044
0.21%
1 ene 2015 año
21.05
+0.597
2.92%
1 ene 2016 año
21.932
+0.882
4.19%
Ranking de los países por los datos estadísticos actuales


Comentarios: