29
/es/
es
AIzaSyAYiBZKx7MnpbEhh9jyipgxe19OcubqV5w
April 1, 2024
225834
Portugal
PRT
true
2
1
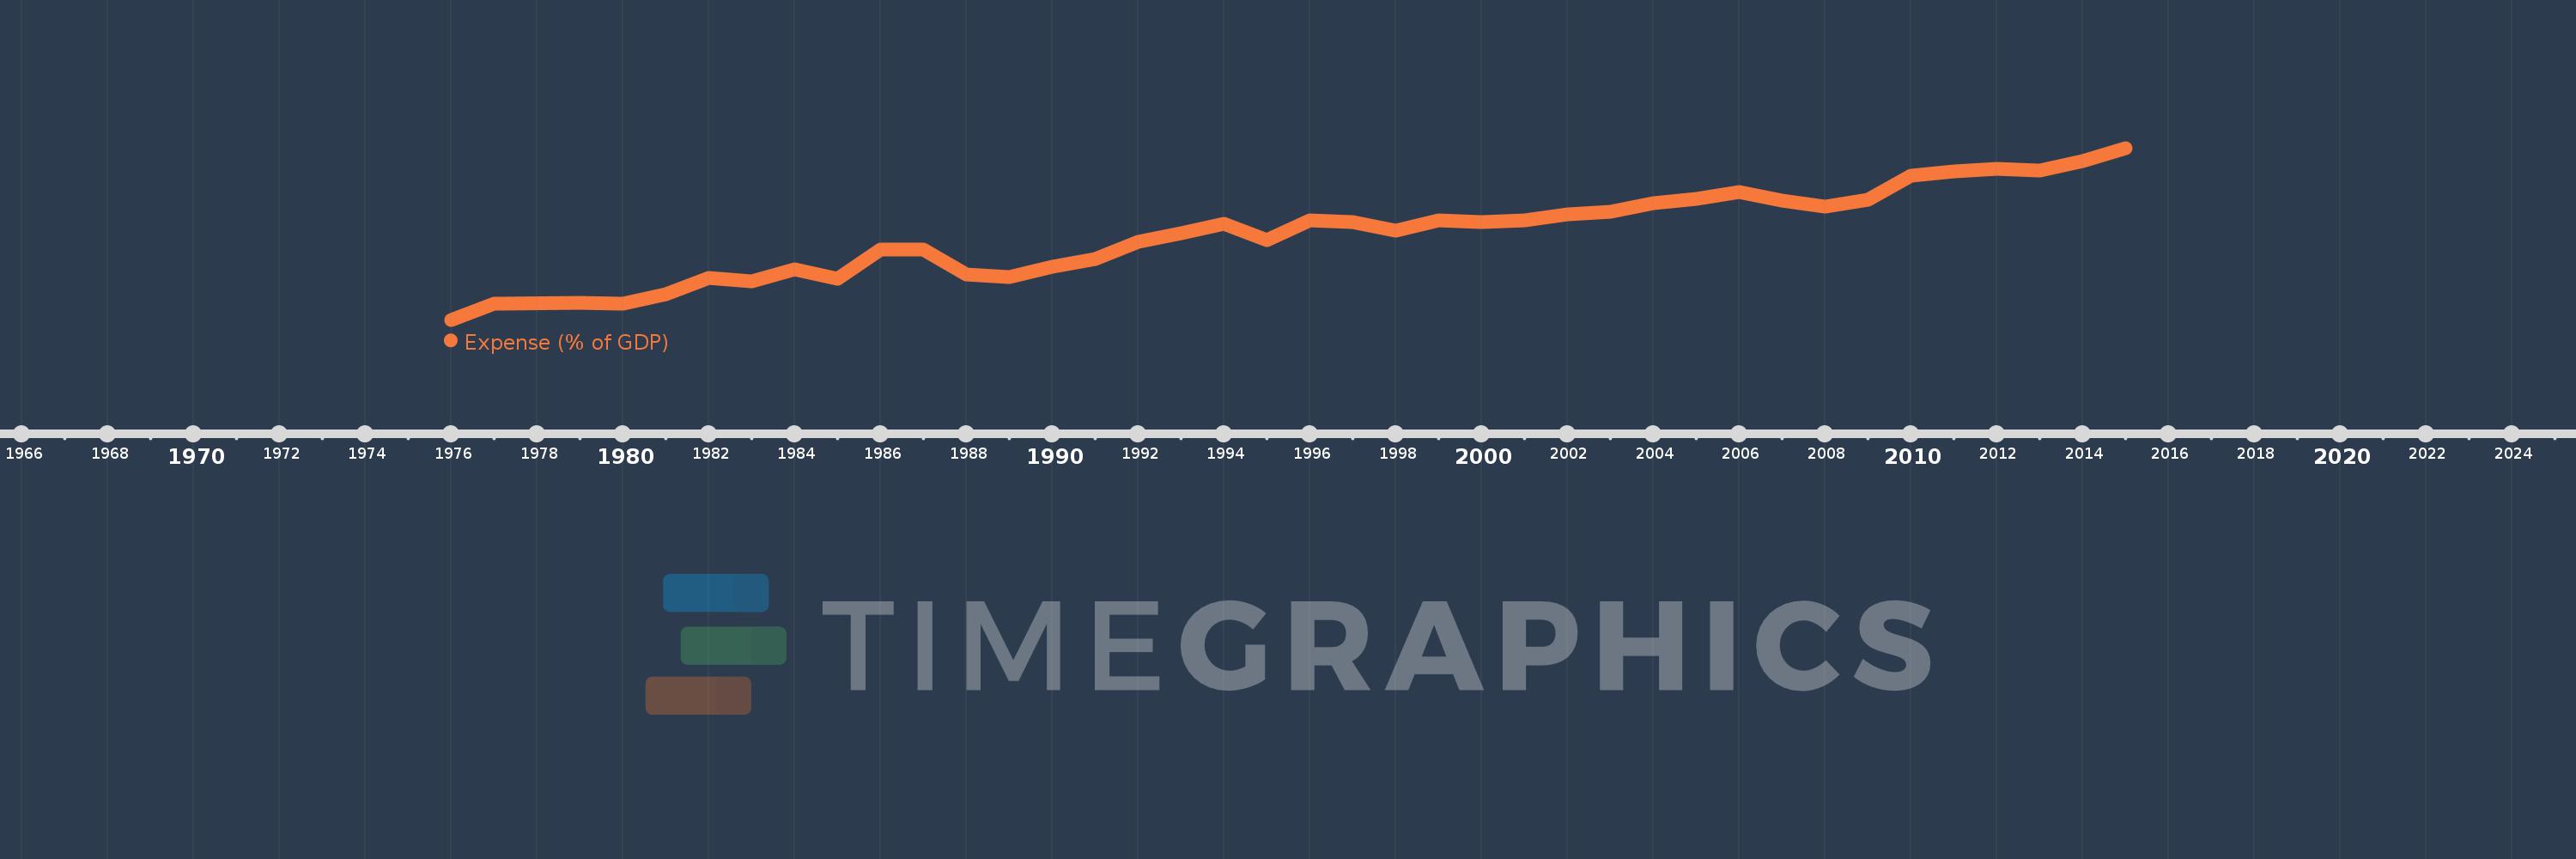
Expense (% of GDP)
2015,2014,2013,2012,2011,2010,2009,2008,2007,2006,2005,2004,2003,2002,2001,2000,1999,1998,1997,1996,1995,1994,1993,1992,1991,1990,1989,1988,1987,1986,1985,1984,1983,1982,1981,1980,1979,1977,1976
Estas estadísticas en otros países:
AfghanistanAlbaniaAlgeriaAngolaAntigua and BarbudaArmeniaAustraliaAustriaAzerbaijanBahamas, TheBahrainBangladeshBarbadosBelarusBelgiumBelizeBeninBhutanBoliviaBosnia and HerzegovinaBotswanaBrazilBulgariaBurkina FasoBurundiCabo VerdeCambodiaCanadaCaribbean small statesCentral African RepublicCentral Europe and the BalticsChileColombiaCongo, Dem. Rep.Congo, Rep.Costa RicaCote d'IvoireCroatiaCyprusCzech RepublicDenmarkDominicaDominican RepublicEarly-demographic dividendEgypt, Arab Rep.El SalvadorEquatorial GuineaEstoniaEthiopiaEuro areaEurope & Central AsiaEurope & Central Asia (excluding high income)Europe & Central Asia (IDA & IBRD countries)European UnionFijiFinlandFranceGambia, TheGeorgiaGermanyGhanaGreeceGrenadaGuatemalaHeavily indebted poor countries (HIPC)High incomeHondurasHong Kong SAR, ChinaHungaryIcelandIDA blendIDA onlyIDA totalIndiaIndonesiaIran, Islamic Rep.IraqIrelandIsraelItalyJamaicaJapanJordanKazakhstanKenyaKiribatiKorea, Rep.KuwaitKyrgyz RepublicLao PDRLatin America & Caribbean Latin America & Caribbean (excluding high income)Latin America & the Caribbean (IDA & IBRD countries)LatviaLeast developed countries: UN classificationLebanonLesothoLiberiaLithuaniaLow incomeLower middle incomeLuxembourgMacao SAR, ChinaMacedonia, FYRMadagascarMalawiMalaysiaMaldivesMaliMaltaMauritiusMexicoMicronesia, Fed. Sts.Middle East & North Africa (excluding high income)Middle East & North Africa (IDA & IBRD countries)MoldovaMongoliaMoroccoMozambiqueMyanmarNamibiaNepalNetherlandsNew ZealandNicaraguaNigeriaNorth AmericaNorwayOECD membersOmanOther small statesPacific island small statesPakistanPanamaPapua New GuineaParaguayPeruPhilippinesPolandPortugalPost-demographic dividendPre-demographic dividendQatarRomaniaRussian FederationRwandaSamoaSan MarinoSao Tome and PrincipeSenegalSerbiaSeychellesSierra LeoneSingaporeSlovak RepublicSloveniaSmall statesSolomon IslandsSouth AfricaSouth AsiaSouth Asia (IDA & IBRD)SpainSri LankaSt. Kitts and NevisSt. LuciaSub-Saharan Africa Sub-Saharan Africa (excluding high income)Sub-Saharan Africa (IDA & IBRD countries)SurinameSwazilandSwedenSwitzerlandSyrian Arab RepublicTajikistanTanzaniaThailandTimor-LesteTogoTrinidad and TobagoTunisiaTurkeyUgandaUkraineUnited Arab EmiratesUnited KingdomUnited StatesUruguayVanuatuVenezuela, RBVietnamWest Bank and GazaWorldYemen, Rep.ZambiaZimbabwe línea de tiempo (timeline):
En esta escala de tiempo se presenta un gráfico de 1976 y 2015 de Portugal. Los datos de 1975 están ausentes. El número de observaciones reales por fecha: 39.
Fuente (nombre):
Indicadores del desarrollo mundial
Fuente (organización):
International Monetary Fund, Government Finance Statistics Yearbook and data files, and World Bank and OECD GDP estimates.
Categorías:
Economy & Growth, Public Sector
Se ha actualizado:
23 abr 2017 año
Los indicadores de los cambios de valor en los últimos años
Mínimo:
23.716
1 ene 1976 año
Máximo:
47.926
1 ene 2015 año
A la fecha de observación
Valor
Cambio absoluto
El cambio con respecto al valor anterior
1 ene 1976 año
23.716
+23.716
0.0%
1 ene 1977 año
25.928
+2.212
9.33%
1 ene 1979 año
26.156
+0.228
0.88%
1 ene 1980 año
25.974
-0.182
-0.69%
1 ene 1981 año
27.365
+1.391
5.36%
1 ene 1982 año
29.578
+2.213
8.09%
1 ene 1983 año
29.077
-0.501
-1.69%
1 ene 1984 año
30.801
+1.724
5.93%
1 ene 1985 año
29.509
-1.292
-4.19%
1 ene 1986 año
33.573
+4.064
13.77%
1 ene 1987 año
33.658
+0.086
0.26%
1 ene 1988 año
30.129
-3.53
-10.49%
1 ene 1989 año
29.791
-0.338
-1.12%
1 ene 1990 año
31.151
+1.36
4.57%
1 ene 1991 año
32.319
+1.168
3.75%
1 ene 1992 año
34.727
+2.408
7.45%
1 ene 1993 año
35.876
+1.148
3.31%
1 ene 1994 año
37.238
+1.362
3.8%
1 ene 1995 año
34.967
-2.271
-6.1%
1 ene 1996 año
37.724
+2.757
7.89%
1 ene 1997 año
37.508
-0.216
-0.57%
1 ene 1998 año
36.32
-1.188
-3.17%
1 ene 1999 año
37.661
+1.341
3.69%
1 ene 2000 año
37.445
-0.216
-0.57%
1 ene 2001 año
37.712
+0.267
0.71%
1 ene 2002 año
38.563
+0.85
2.25%
1 ene 2003 año
38.909
+0.346
0.9%
1 ene 2004 año
40.157
+1.248
3.21%
1 ene 2005 año
40.768
+0.611
1.52%
1 ene 2006 año
41.729
+0.961
2.36%
1 ene 2007 año
40.477
-1.252
-3.0%
1 ene 2008 año
39.685
-0.792
-1.96%
1 ene 2009 año
40.658
+0.973
2.45%
1 ene 2010 año
43.974
+3.316
8.16%
1 ene 2011 año
44.606
+0.632
1.44%
1 ene 2012 año
44.983
+0.376
0.84%
1 ene 2013 año
44.769
-0.213
-0.47%
1 ene 2014 año
46.05
+1.281
2.86%
1 ene 2015 año
47.926
+1.876
4.07%
Ranking de los países por los datos estadísticos actuales


Comentarios: