29
/es/
es
AIzaSyAYiBZKx7MnpbEhh9jyipgxe19OcubqV5w
April 1, 2024
52942
OECD members
OED
false
2
1
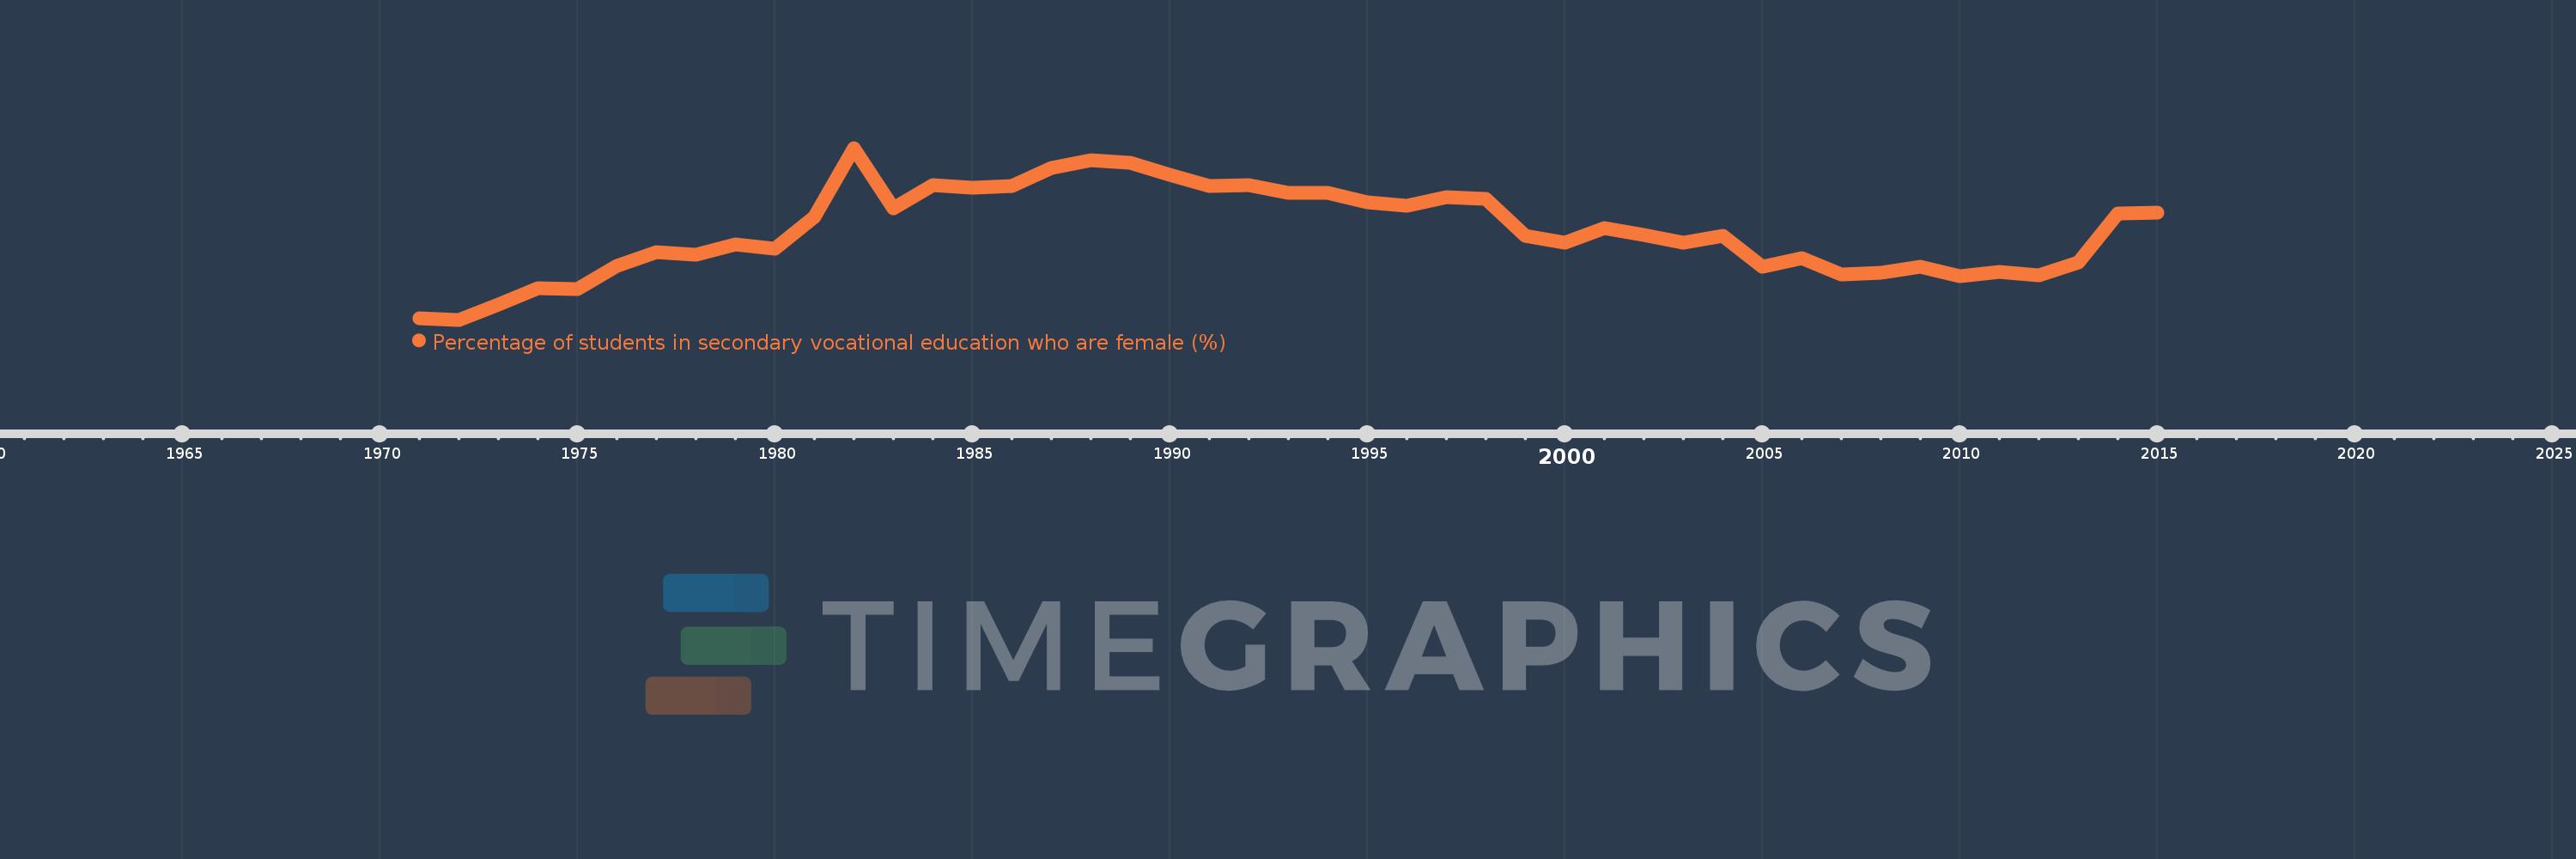
Percentage of students in secondary vocational education who are female (%)
2015,2014,2013,2012,2011,2010,2009,2008,2007,2006,2005,2004,2003,2002,2001,2000,1999,1998,1997,1996,1995,1994,1993,1992,1991,1990,1989,1988,1987,1986,1985,1984,1983,1982,1981,1980,1979,1978,1977,1976,1975,1974,1973,1972,1971
Estas estadísticas en otros países:
AfghanistanAlbaniaAlgeriaAndorraAngolaAntigua and BarbudaArab WorldArgentinaArmeniaArubaAustraliaAustriaAzerbaijanBahrainBangladeshBarbadosBelarusBelgiumBelizeBeninBermudaBhutanBoliviaBosnia and HerzegovinaBotswanaBrazilBritish Virgin IslandsBrunei DarussalamBulgariaBurkina FasoBurundiCabo VerdeCambodiaCameroonCanadaCaribbean small statesCentral African RepublicCentral Europe and the BalticsChadChileChinaColombiaComorosCongo, Dem. Rep.Congo, Rep.Costa RicaCote d'IvoireCroatiaCubaCuracaoCyprusCzech RepublicDenmarkDjiboutiDominicaDominican RepublicEarly-demographic dividendEast Asia & PacificEast Asia & Pacific (excluding high income)East Asia & Pacific (IDA & IBRD countries)EcuadorEgypt, Arab Rep.El SalvadorEquatorial GuineaEritreaEstoniaEthiopiaEuro areaEurope & Central AsiaEurope & Central Asia (excluding high income)Europe & Central Asia (IDA & IBRD countries)European UnionFijiFinlandFragile and conflict affected situationsFranceGabonGambia, TheGeorgiaGermanyGhanaGibraltarGreeceGrenadaGuatemalaGuineaGuinea-BissauGuyanaHaitiHeavily indebted poor countries (HIPC)High incomeHondurasHong Kong SAR, ChinaHungaryIBRD onlyIcelandIDA & IBRD totalIDA blendIDA onlyIDA totalIndiaIndonesiaIran, Islamic Rep.IraqIrelandIsraelItalyJamaicaJapanJordanKazakhstanKenyaKiribatiKorea, Rep.KuwaitKyrgyz RepublicLao PDRLate-demographic dividendLatin America & Caribbean Latin America & Caribbean (excluding high income)Latin America & the Caribbean (IDA & IBRD countries)LatviaLeast developed countries: UN classificationLebanonLesothoLiberiaLibyaLiechtensteinLithuaniaLow & middle incomeLow incomeLower middle incomeLuxembourgMacao SAR, ChinaMacedonia, FYRMadagascarMalawiMalaysiaMaldivesMaliMaltaMarshall IslandsMauritaniaMauritiusMexicoMicronesia, Fed. Sts.Middle East & North AfricaMiddle East & North Africa (excluding high income)Middle East & North Africa (IDA & IBRD countries)Middle incomeMoldovaMonacoMongoliaMontenegroMoroccoMozambiqueMyanmarNamibiaNauruNepalNetherlandsNew ZealandNicaraguaNigerNigeriaNorth AmericaNorwayOECD membersOmanOther small statesPacific island small statesPakistanPanamaPapua New GuineaParaguayPeruPolandPortugalPost-demographic dividendPre-demographic dividendPuerto RicoQatarRomaniaRussian FederationRwandaSamoaSan MarinoSao Tome and PrincipeSaudi ArabiaSenegalSerbiaSeychellesSierra LeoneSingaporeSint Maarten (Dutch part)Slovak RepublicSloveniaSmall statesSolomon IslandsSomaliaSouth AfricaSouth AsiaSouth Asia (IDA & IBRD)SpainSri LankaSt. Kitts and NevisSt. LuciaSt. Vincent and the GrenadinesSub-Saharan Africa Sub-Saharan Africa (excluding high income)Sub-Saharan Africa (IDA & IBRD countries)SudanSurinameSwazilandSwedenSwitzerlandSyrian Arab RepublicTajikistanTanzaniaThailandTimor-LesteTogoTongaTrinidad and TobagoTunisiaTurkeyTurkmenistanTurks and Caicos IslandsTuvaluUgandaUkraineUnited Arab EmiratesUnited KingdomUpper middle incomeUruguayUzbekistanVanuatuVenezuela, RBVietnamWest Bank and GazaWorldYemen, Rep.ZambiaZimbabwe línea de tiempo (timeline):
En esta escala de tiempo se presenta un gráfico de 1971 y 2015 de OECD members. Los datos de 1970 están ausentes. El número de observaciones reales por fecha: 45.
Fuente (nombre):
Indicadores del desarrollo mundial
Fuente (organización):
UNESCO Institute for Statistics
Categorías:
Education, Gender
Se ha actualizado:
23 abr 2017 año
Los indicadores de los cambios de valor en los últimos años
Mínimo:
42.864
1 ene 1972 año
Máximo:
47.306
1 ene 1982 año
A la fecha de observación
Valor
Cambio absoluto
El cambio con respecto al valor anterior
1 ene 1971 año
42.9
+42.9
0.0%
1 ene 1972 año
42.864
-0.036
-0.08%
1 ene 1973 año
43.254
+0.39
0.91%
1 ene 1974 año
43.689
+0.435
1.01%
1 ene 1975 año
43.655
-0.034
-0.08%
1 ene 1976 año
44.258
+0.603
1.38%
1 ene 1977 año
44.609
+0.351
0.79%
1 ene 1978 año
44.553
-0.056
-0.12%
1 ene 1979 año
44.802
+0.248
0.56%
1 ene 1980 año
44.705
-0.096
-0.22%
1 ene 1981 año
45.533
+0.828
1.85%
1 ene 1982 año
47.306
+1.773
3.89%
1 ene 1983 año
45.751
-1.555
-3.29%
1 ene 1984 año
46.351
+0.601
1.31%
1 ene 1985 año
46.282
-0.069
-0.15%
1 ene 1986 año
46.325
+0.042
0.09%
1 ene 1987 año
46.78
+0.456
0.98%
1 ene 1988 año
46.987
+0.207
0.44%
1 ene 1989 año
46.922
-0.065
-0.14%
1 ene 1990 año
46.615
-0.307
-0.65%
1 ene 1991 año
46.333
-0.283
-0.61%
1 ene 1992 año
46.354
+0.021
0.05%
1 ene 1993 año
46.135
-0.219
-0.47%
1 ene 1994 año
46.147
+0.012
0.03%
1 ene 1995 año
45.907
-0.24
-0.52%
1 ene 1996 año
45.819
-0.088
-0.19%
1 ene 1997 año
46.031
+0.212
0.46%
1 ene 1998 año
45.996
-0.035
-0.08%
1 ene 1999 año
45.034
-0.961
-2.09%
1 ene 2000 año
44.861
-0.173
-0.39%
1 ene 2001 año
45.23
+0.369
0.82%
1 ene 2002 año
45.047
-0.183
-0.41%
1 ene 2003 año
44.846
-0.201
-0.45%
1 ene 2004 año
45.032
+0.186
0.41%
1 ene 2005 año
44.233
-0.799
-1.77%
1 ene 2006 año
44.447
+0.214
0.48%
1 ene 2007 año
44.043
-0.404
-0.91%
1 ene 2008 año
44.084
+0.04
0.09%
1 ene 2009 año
44.239
+0.155
0.35%
1 ene 2010 año
43.982
-0.257
-0.58%
1 ene 2011 año
44.097
+0.115
0.26%
1 ene 2012 año
44.017
-0.08
-0.18%
1 ene 2013 año
44.34
+0.323
0.73%
1 ene 2014 año
45.618
+1.278
2.88%
1 ene 2015 año
45.629
+0.011
0.02%
Ranking de los países por los datos estadísticos actuales


Comentarios: