29
/es/
es
AIzaSyAYiBZKx7MnpbEhh9jyipgxe19OcubqV5w
April 1, 2024
38477
IDA blend
IDB
false
2
1
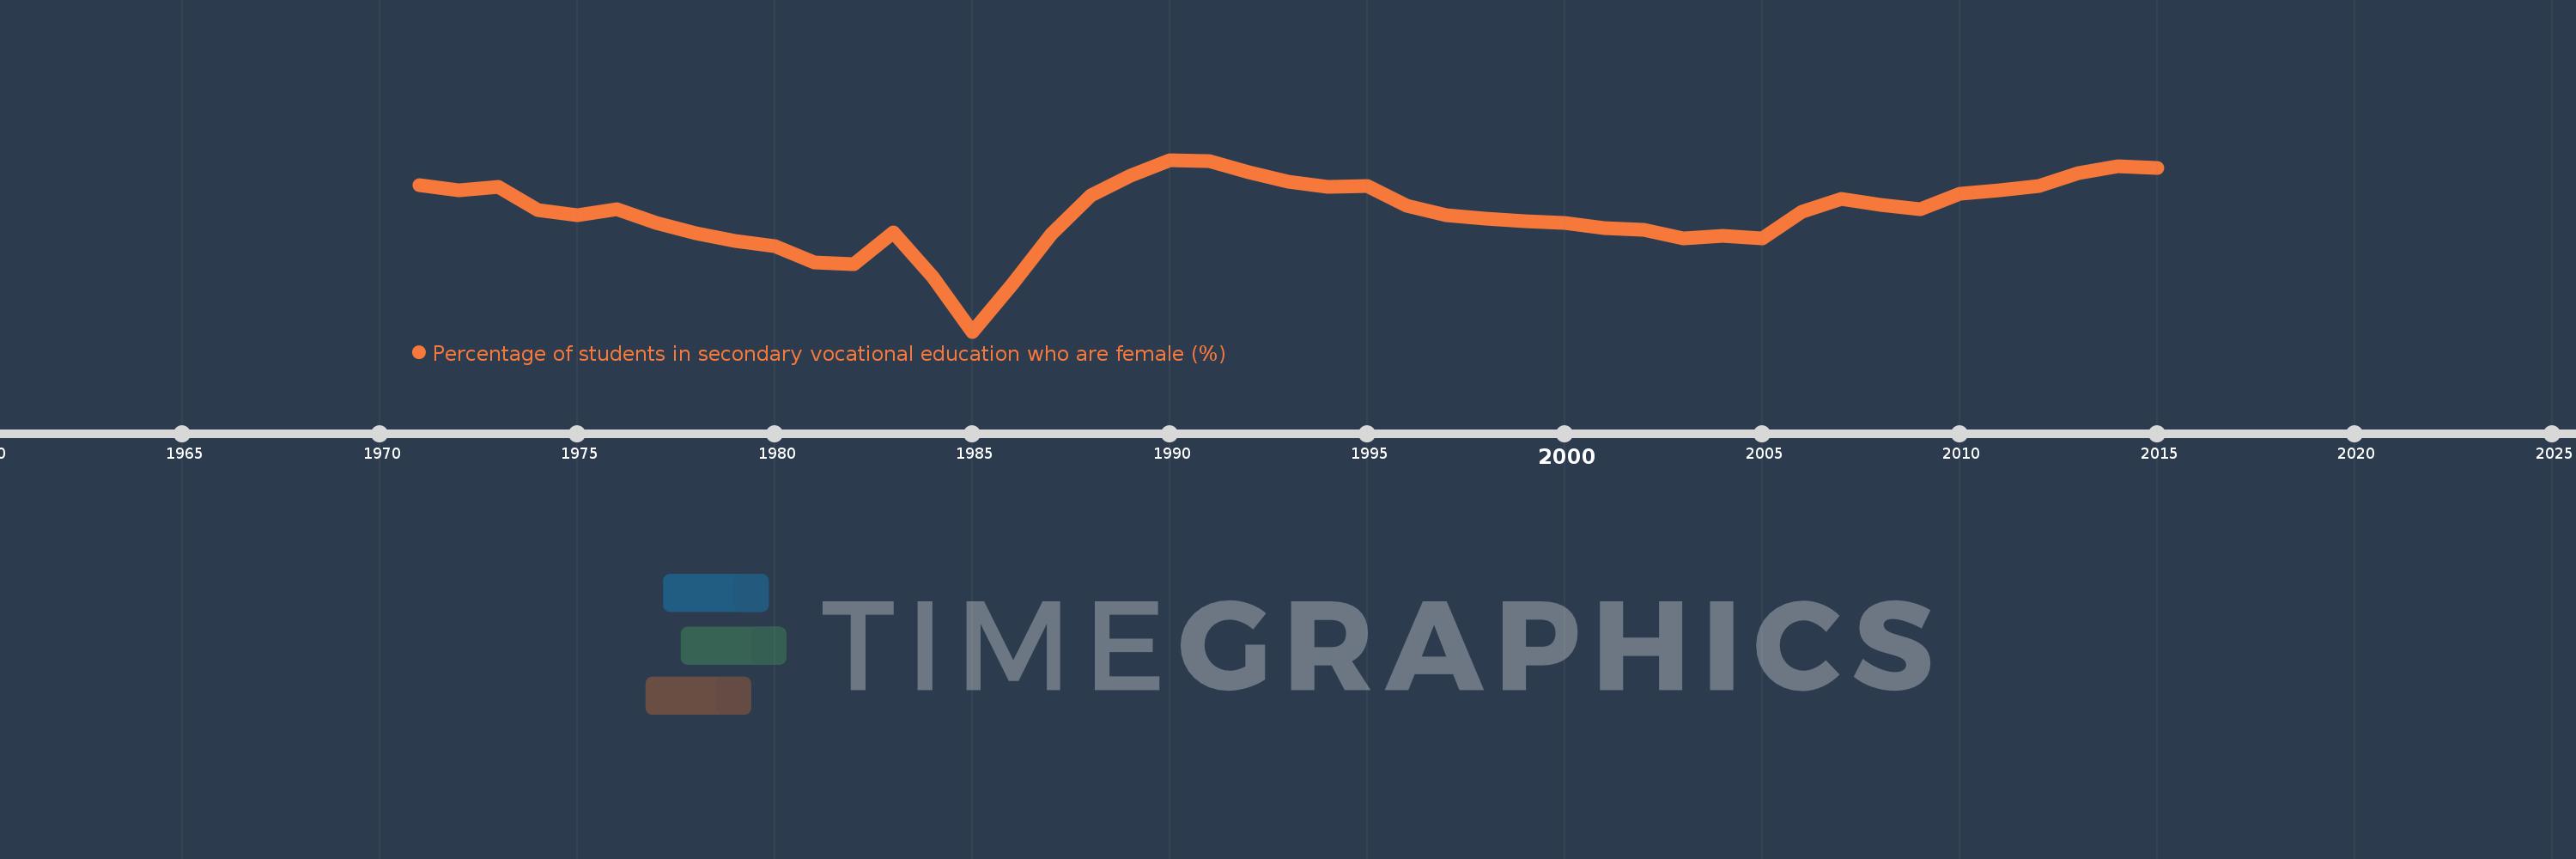
Percentage of students in secondary vocational education who are female (%)
2015,2014,2013,2012,2011,2010,2009,2008,2007,2006,2005,2004,2003,2002,2001,2000,1999,1998,1997,1996,1995,1994,1993,1992,1991,1990,1989,1988,1987,1986,1985,1984,1983,1982,1981,1980,1979,1978,1977,1976,1975,1974,1973,1972,1971
Estas estadísticas en otros países:
AfghanistanAlbaniaAlgeriaAndorraAngolaAntigua and BarbudaArab WorldArgentinaArmeniaArubaAustraliaAustriaAzerbaijanBahrainBangladeshBarbadosBelarusBelgiumBelizeBeninBermudaBhutanBoliviaBosnia and HerzegovinaBotswanaBrazilBritish Virgin IslandsBrunei DarussalamBulgariaBurkina FasoBurundiCabo VerdeCambodiaCameroonCanadaCaribbean small statesCentral African RepublicCentral Europe and the BalticsChadChileChinaColombiaComorosCongo, Dem. Rep.Congo, Rep.Costa RicaCote d'IvoireCroatiaCubaCuracaoCyprusCzech RepublicDenmarkDjiboutiDominicaDominican RepublicEarly-demographic dividendEast Asia & PacificEast Asia & Pacific (excluding high income)East Asia & Pacific (IDA & IBRD countries)EcuadorEgypt, Arab Rep.El SalvadorEquatorial GuineaEritreaEstoniaEthiopiaEuro areaEurope & Central AsiaEurope & Central Asia (excluding high income)Europe & Central Asia (IDA & IBRD countries)European UnionFijiFinlandFragile and conflict affected situationsFranceGabonGambia, TheGeorgiaGermanyGhanaGibraltarGreeceGrenadaGuatemalaGuineaGuinea-BissauGuyanaHaitiHeavily indebted poor countries (HIPC)High incomeHondurasHong Kong SAR, ChinaHungaryIBRD onlyIcelandIDA & IBRD totalIDA blendIDA onlyIDA totalIndiaIndonesiaIran, Islamic Rep.IraqIrelandIsraelItalyJamaicaJapanJordanKazakhstanKenyaKiribatiKorea, Rep.KuwaitKyrgyz RepublicLao PDRLate-demographic dividendLatin America & Caribbean Latin America & Caribbean (excluding high income)Latin America & the Caribbean (IDA & IBRD countries)LatviaLeast developed countries: UN classificationLebanonLesothoLiberiaLibyaLiechtensteinLithuaniaLow & middle incomeLow incomeLower middle incomeLuxembourgMacao SAR, ChinaMacedonia, FYRMadagascarMalawiMalaysiaMaldivesMaliMaltaMarshall IslandsMauritaniaMauritiusMexicoMicronesia, Fed. Sts.Middle East & North AfricaMiddle East & North Africa (excluding high income)Middle East & North Africa (IDA & IBRD countries)Middle incomeMoldovaMonacoMongoliaMontenegroMoroccoMozambiqueMyanmarNamibiaNauruNepalNetherlandsNew ZealandNicaraguaNigerNigeriaNorth AmericaNorwayOECD membersOmanOther small statesPacific island small statesPakistanPanamaPapua New GuineaParaguayPeruPolandPortugalPost-demographic dividendPre-demographic dividendPuerto RicoQatarRomaniaRussian FederationRwandaSamoaSan MarinoSao Tome and PrincipeSaudi ArabiaSenegalSerbiaSeychellesSierra LeoneSingaporeSint Maarten (Dutch part)Slovak RepublicSloveniaSmall statesSolomon IslandsSomaliaSouth AfricaSouth AsiaSouth Asia (IDA & IBRD)SpainSri LankaSt. Kitts and NevisSt. LuciaSt. Vincent and the GrenadinesSub-Saharan Africa Sub-Saharan Africa (excluding high income)Sub-Saharan Africa (IDA & IBRD countries)SudanSurinameSwazilandSwedenSwitzerlandSyrian Arab RepublicTajikistanTanzaniaThailandTimor-LesteTogoTongaTrinidad and TobagoTunisiaTurkeyTurkmenistanTurks and Caicos IslandsTuvaluUgandaUkraineUnited Arab EmiratesUnited KingdomUpper middle incomeUruguayUzbekistanVanuatuVenezuela, RBVietnamWest Bank and GazaWorldYemen, Rep.ZambiaZimbabwe línea de tiempo (timeline):
En esta escala de tiempo se presenta un gráfico de 1971 y 2015 de IDA blend. Los datos de 1970 están ausentes. El número de observaciones reales por fecha: 45.
Fuente (nombre):
Indicadores del desarrollo mundial
Fuente (organización):
UNESCO Institute for Statistics
Categorías:
Education, Gender
Se ha actualizado:
23 abr 2017 año
Los indicadores de los cambios de valor en los últimos años
Mínimo:
34.509
1 ene 1985 año
Máximo:
44.21
1 ene 1990 año
A la fecha de observación
Valor
Cambio absoluto
El cambio con respecto al valor anterior
1 ene 1971 año
42.791
+42.791
0.0%
1 ene 1972 año
42.498
-0.294
-0.69%
1 ene 1973 año
42.687
+0.189
0.45%
1 ene 1974 año
41.374
-1.313
-3.08%
1 ene 1975 año
41.082
-0.292
-0.71%
1 ene 1976 año
41.4
+0.318
0.77%
1 ene 1977 año
40.635
-0.766
-1.85%
1 ene 1978 año
40.059
-0.575
-1.42%
1 ene 1979 año
39.614
-0.446
-1.11%
1 ene 1980 año
39.35
-0.264
-0.67%
1 ene 1981 año
38.432
-0.918
-2.33%
1 ene 1982 año
38.323
-0.109
-0.28%
1 ene 1983 año
40.103
+1.779
4.64%
1 ene 1984 año
37.61
-2.493
-6.22%
1 ene 1985 año
34.509
-3.101
-8.25%
1 ene 1986 año
37.142
+2.633
7.63%
1 ene 1987 año
40.016
+2.874
7.74%
1 ene 1988 año
42.18
+2.164
5.41%
1 ene 1989 año
43.29
+1.11
2.63%
1 ene 1990 año
44.21
+0.92
2.13%
1 ene 1991 año
44.158
-0.053
-0.12%
1 ene 1992 año
43.492
-0.665
-1.51%
1 ene 1993 año
42.994
-0.498
-1.15%
1 ene 1994 año
42.679
-0.315
-0.73%
1 ene 1995 año
42.721
+0.043
0.1%
1 ene 1996 año
41.593
-1.128
-2.64%
1 ene 1997 año
41.083
-0.51
-1.23%
1 ene 1998 año
40.883
-0.2
-0.49%
1 ene 1999 año
40.729
-0.154
-0.38%
1 ene 2000 año
40.646
-0.083
-0.2%
1 ene 2001 año
40.35
-0.296
-0.73%
1 ene 2002 año
40.245
-0.105
-0.26%
1 ene 2003 año
39.752
-0.493
-1.22%
1 ene 2004 año
39.899
+0.147
0.37%
1 ene 2005 año
39.787
-0.112
-0.28%
1 ene 2006 año
41.274
+1.487
3.74%
1 ene 2007 año
42.01
+0.736
1.78%
1 ene 2008 año
41.656
-0.354
-0.84%
1 ene 2009 año
41.419
-0.237
-0.57%
1 ene 2010 año
42.27
+0.851
2.05%
1 ene 2011 año
42.503
+0.234
0.55%
1 ene 2012 año
42.739
+0.236
0.55%
1 ene 2013 año
43.473
+0.734
1.72%
1 ene 2014 año
43.845
+0.372
0.86%
1 ene 2015 año
43.771
-0.074
-0.17%
Ranking de los países por los datos estadísticos actuales


Comentarios: