29
/es/
es
AIzaSyAYiBZKx7MnpbEhh9jyipgxe19OcubqV5w
April 1, 2024
276051
United Kingdom
GBR
true
2
1
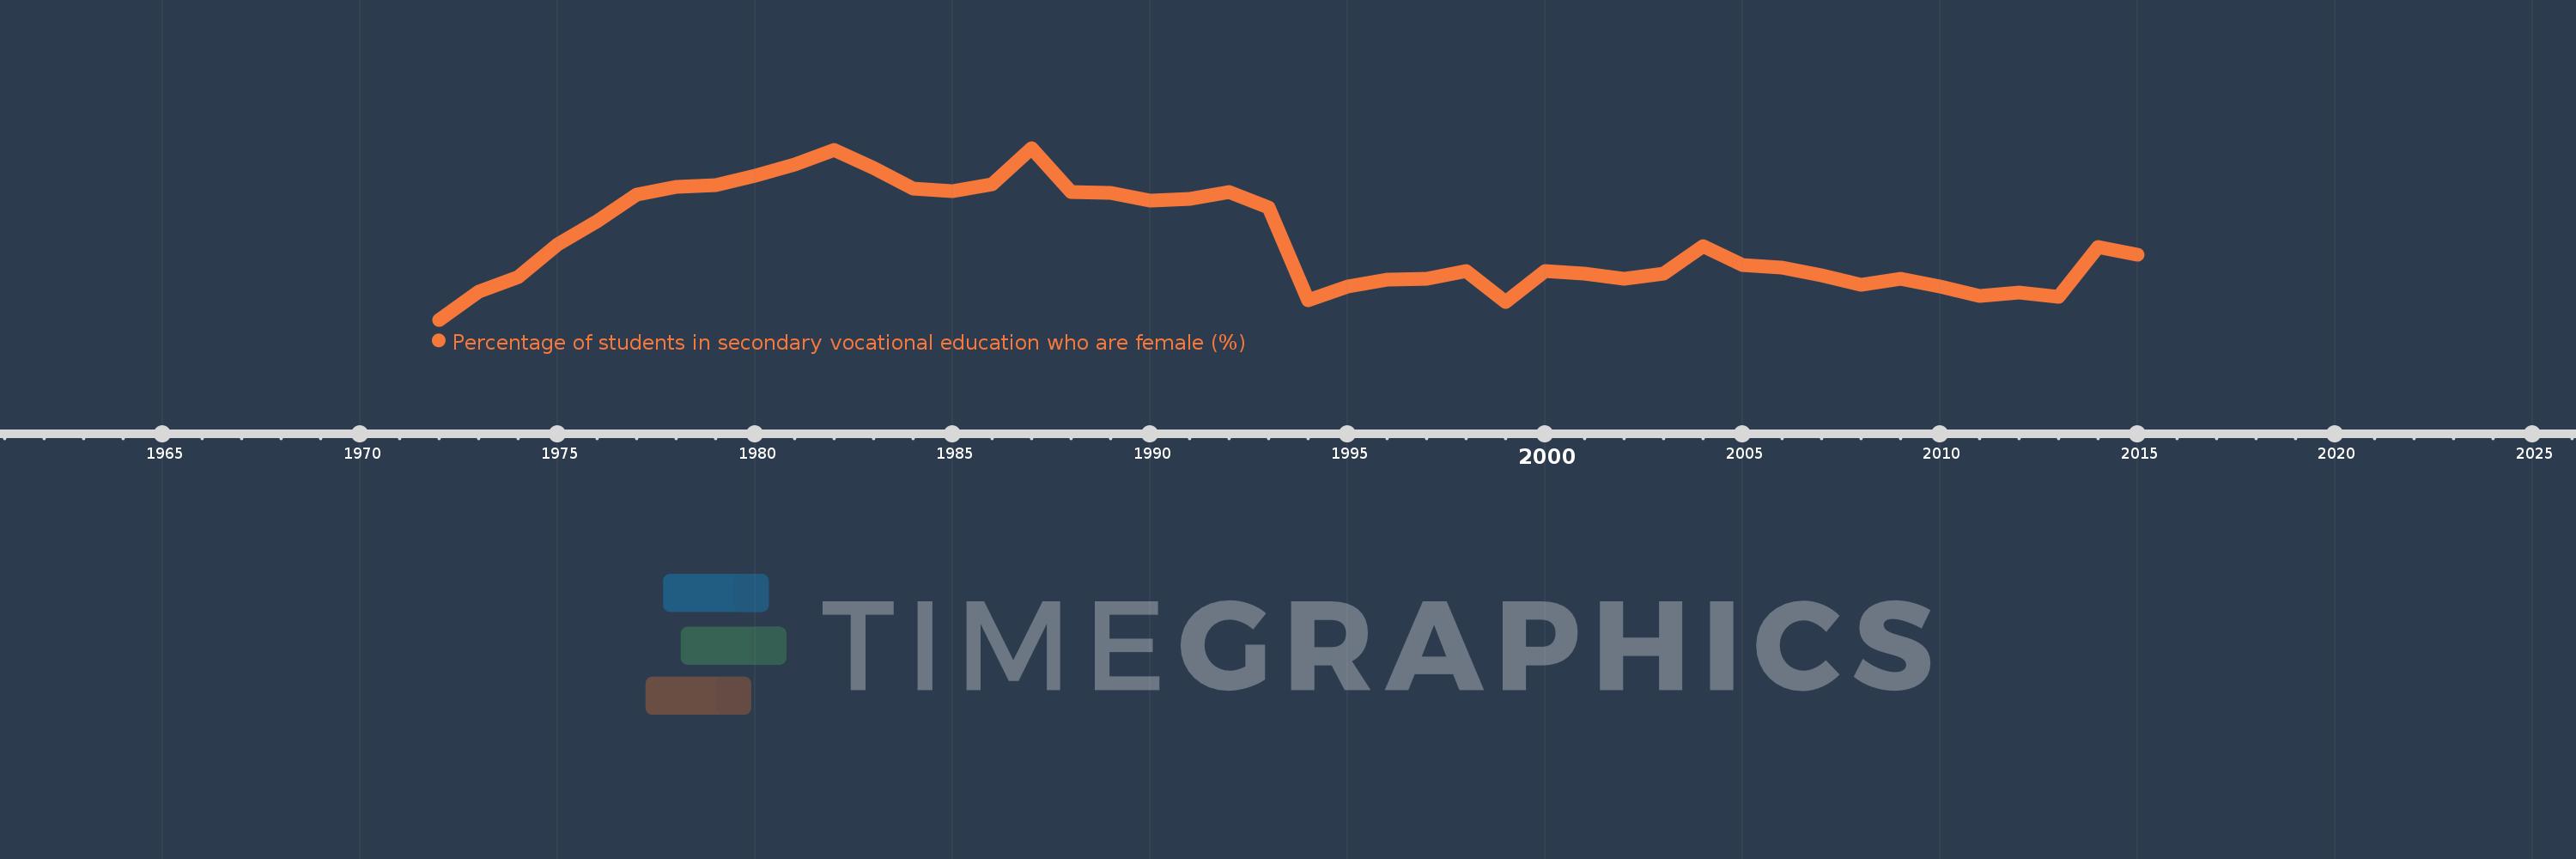
Percentage of students in secondary vocational education who are female (%)
2015,2014,2013,2012,2011,2010,2009,2008,2007,2006,2005,2004,2003,2002,2001,2000,1999,1998,1997,1996,1995,1994,1993,1992,1991,1990,1989,1988,1987,1986,1985,1984,1983,1982,1981,1980,1979,1978,1977,1976,1975,1974,1973,1972
Estas estadísticas en otros países:
AfghanistanAlbaniaAlgeriaAndorraAngolaAntigua and BarbudaArab WorldArgentinaArmeniaArubaAustraliaAustriaAzerbaijanBahrainBangladeshBarbadosBelarusBelgiumBelizeBeninBermudaBhutanBoliviaBosnia and HerzegovinaBotswanaBrazilBritish Virgin IslandsBrunei DarussalamBulgariaBurkina FasoBurundiCabo VerdeCambodiaCameroonCanadaCaribbean small statesCentral African RepublicCentral Europe and the BalticsChadChileChinaColombiaComorosCongo, Dem. Rep.Congo, Rep.Costa RicaCote d'IvoireCroatiaCubaCuracaoCyprusCzech RepublicDenmarkDjiboutiDominicaDominican RepublicEarly-demographic dividendEast Asia & PacificEast Asia & Pacific (excluding high income)East Asia & Pacific (IDA & IBRD countries)EcuadorEgypt, Arab Rep.El SalvadorEquatorial GuineaEritreaEstoniaEthiopiaEuro areaEurope & Central AsiaEurope & Central Asia (excluding high income)Europe & Central Asia (IDA & IBRD countries)European UnionFijiFinlandFragile and conflict affected situationsFranceGabonGambia, TheGeorgiaGermanyGhanaGibraltarGreeceGrenadaGuatemalaGuineaGuinea-BissauGuyanaHaitiHeavily indebted poor countries (HIPC)High incomeHondurasHong Kong SAR, ChinaHungaryIBRD onlyIcelandIDA & IBRD totalIDA blendIDA onlyIDA totalIndiaIndonesiaIran, Islamic Rep.IraqIrelandIsraelItalyJamaicaJapanJordanKazakhstanKenyaKiribatiKorea, Rep.KuwaitKyrgyz RepublicLao PDRLate-demographic dividendLatin America & Caribbean Latin America & Caribbean (excluding high income)Latin America & the Caribbean (IDA & IBRD countries)LatviaLeast developed countries: UN classificationLebanonLesothoLiberiaLibyaLiechtensteinLithuaniaLow & middle incomeLow incomeLower middle incomeLuxembourgMacao SAR, ChinaMacedonia, FYRMadagascarMalawiMalaysiaMaldivesMaliMaltaMarshall IslandsMauritaniaMauritiusMexicoMicronesia, Fed. Sts.Middle East & North AfricaMiddle East & North Africa (excluding high income)Middle East & North Africa (IDA & IBRD countries)Middle incomeMoldovaMonacoMongoliaMontenegroMoroccoMozambiqueMyanmarNamibiaNauruNepalNetherlandsNew ZealandNicaraguaNigerNigeriaNorth AmericaNorwayOECD membersOmanOther small statesPacific island small statesPakistanPanamaPapua New GuineaParaguayPeruPolandPortugalPost-demographic dividendPre-demographic dividendPuerto RicoQatarRomaniaRussian FederationRwandaSamoaSan MarinoSao Tome and PrincipeSaudi ArabiaSenegalSerbiaSeychellesSierra LeoneSingaporeSint Maarten (Dutch part)Slovak RepublicSloveniaSmall statesSolomon IslandsSomaliaSouth AfricaSouth AsiaSouth Asia (IDA & IBRD)SpainSri LankaSt. Kitts and NevisSt. LuciaSt. Vincent and the GrenadinesSub-Saharan Africa Sub-Saharan Africa (excluding high income)Sub-Saharan Africa (IDA & IBRD countries)SudanSurinameSwazilandSwedenSwitzerlandSyrian Arab RepublicTajikistanTanzaniaThailandTimor-LesteTogoTongaTrinidad and TobagoTunisiaTurkeyTurkmenistanTurks and Caicos IslandsTuvaluUgandaUkraineUnited Arab EmiratesUnited KingdomUpper middle incomeUruguayUzbekistanVanuatuVenezuela, RBVietnamWest Bank and GazaWorldYemen, Rep.ZambiaZimbabwe línea de tiempo (timeline):
En esta escala de tiempo se presenta un gráfico de 1972 y 2015 de United Kingdom. Los datos de 1971 están ausentes. El número de observaciones reales por fecha: 44.
Fuente (nombre):
Indicadores del desarrollo mundial
Fuente (organización):
UNESCO Institute for Statistics
Categorías:
Education, Gender
Se ha actualizado:
23 abr 2017 año
Los indicadores de los cambios de valor en los últimos años
Mínimo:
45.673
1 ene 1972 año
Máximo:
57.32
1 ene 1987 año
A la fecha de observación
Valor
Cambio absoluto
El cambio con respecto al valor anterior
1 ene 1972 año
45.673
+45.673
0.0%
1 ene 1973 año
47.597
+1.924
4.21%
1 ene 1974 año
48.574
+0.977
2.05%
1 ene 1975 año
50.808
+2.234
4.6%
1 ene 1976 año
52.349
+1.541
3.03%
1 ene 1977 año
54.14
+1.791
3.42%
1 ene 1978 año
54.67
+0.53
0.98%
1 ene 1979 año
54.803
+0.132
0.24%
1 ene 1980 año
55.425
+0.623
1.14%
1 ene 1981 año
56.173
+0.747
1.35%
1 ene 1982 año
57.158
+0.985
1.75%
1 ene 1983 año
55.957
-1.201
-2.1%
1 ene 1984 año
54.545
-1.412
-2.52%
1 ene 1985 año
54.369
-0.177
-0.32%
1 ene 1986 año
54.863
+0.494
0.91%
1 ene 1987 año
57.32
+2.457
4.48%
1 ene 1988 año
54.306
-3.014
-5.26%
1 ene 1989 año
54.265
-0.041
-0.08%
1 ene 1990 año
53.766
-0.499
-0.92%
1 ene 1991 año
53.88
+0.114
0.21%
1 ene 1992 año
54.309
+0.429
0.8%
1 ene 1993 año
53.291
-1.018
-1.87%
1 ene 1994 año
46.975
-6.316
-11.85%
1 ene 1995 año
47.915
+0.94
2.0%
1 ene 1996 año
48.402
+0.487
1.02%
1 ene 1997 año
48.424
+0.022
0.05%
1 ene 1998 año
48.983
+0.559
1.16%
1 ene 1999 año
46.881
-2.102
-4.29%
1 ene 2000 año
48.959
+2.077
4.43%
1 ene 2001 año
48.819
-0.139
-0.28%
1 ene 2002 año
48.448
-0.371
-0.76%
1 ene 2003 año
48.774
+0.326
0.67%
1 ene 2004 año
50.691
+1.917
3.93%
1 ene 2005 año
49.36
-1.332
-2.63%
1 ene 2006 año
49.231
-0.129
-0.26%
1 ene 2007 año
48.655
-0.575
-1.17%
1 ene 2008 año
48.019
-0.637
-1.31%
1 ene 2009 año
48.444
+0.425
0.89%
1 ene 2010 año
47.925
-0.52
-1.07%
1 ene 2011 año
47.312
-0.613
-1.28%
1 ene 2012 año
47.537
+0.226
0.48%
1 ene 2013 año
47.242
-0.295
-0.62%
1 ene 2014 año
50.609
+3.367
7.13%
1 ene 2015 año
50.092
-0.517
-1.02%
Ranking de los países por los datos estadísticos actuales


Comentarios: