29
/es/
es
AIzaSyAYiBZKx7MnpbEhh9jyipgxe19OcubqV5w
April 1, 2024
45457
Low & middle income
LMY
false
2
1
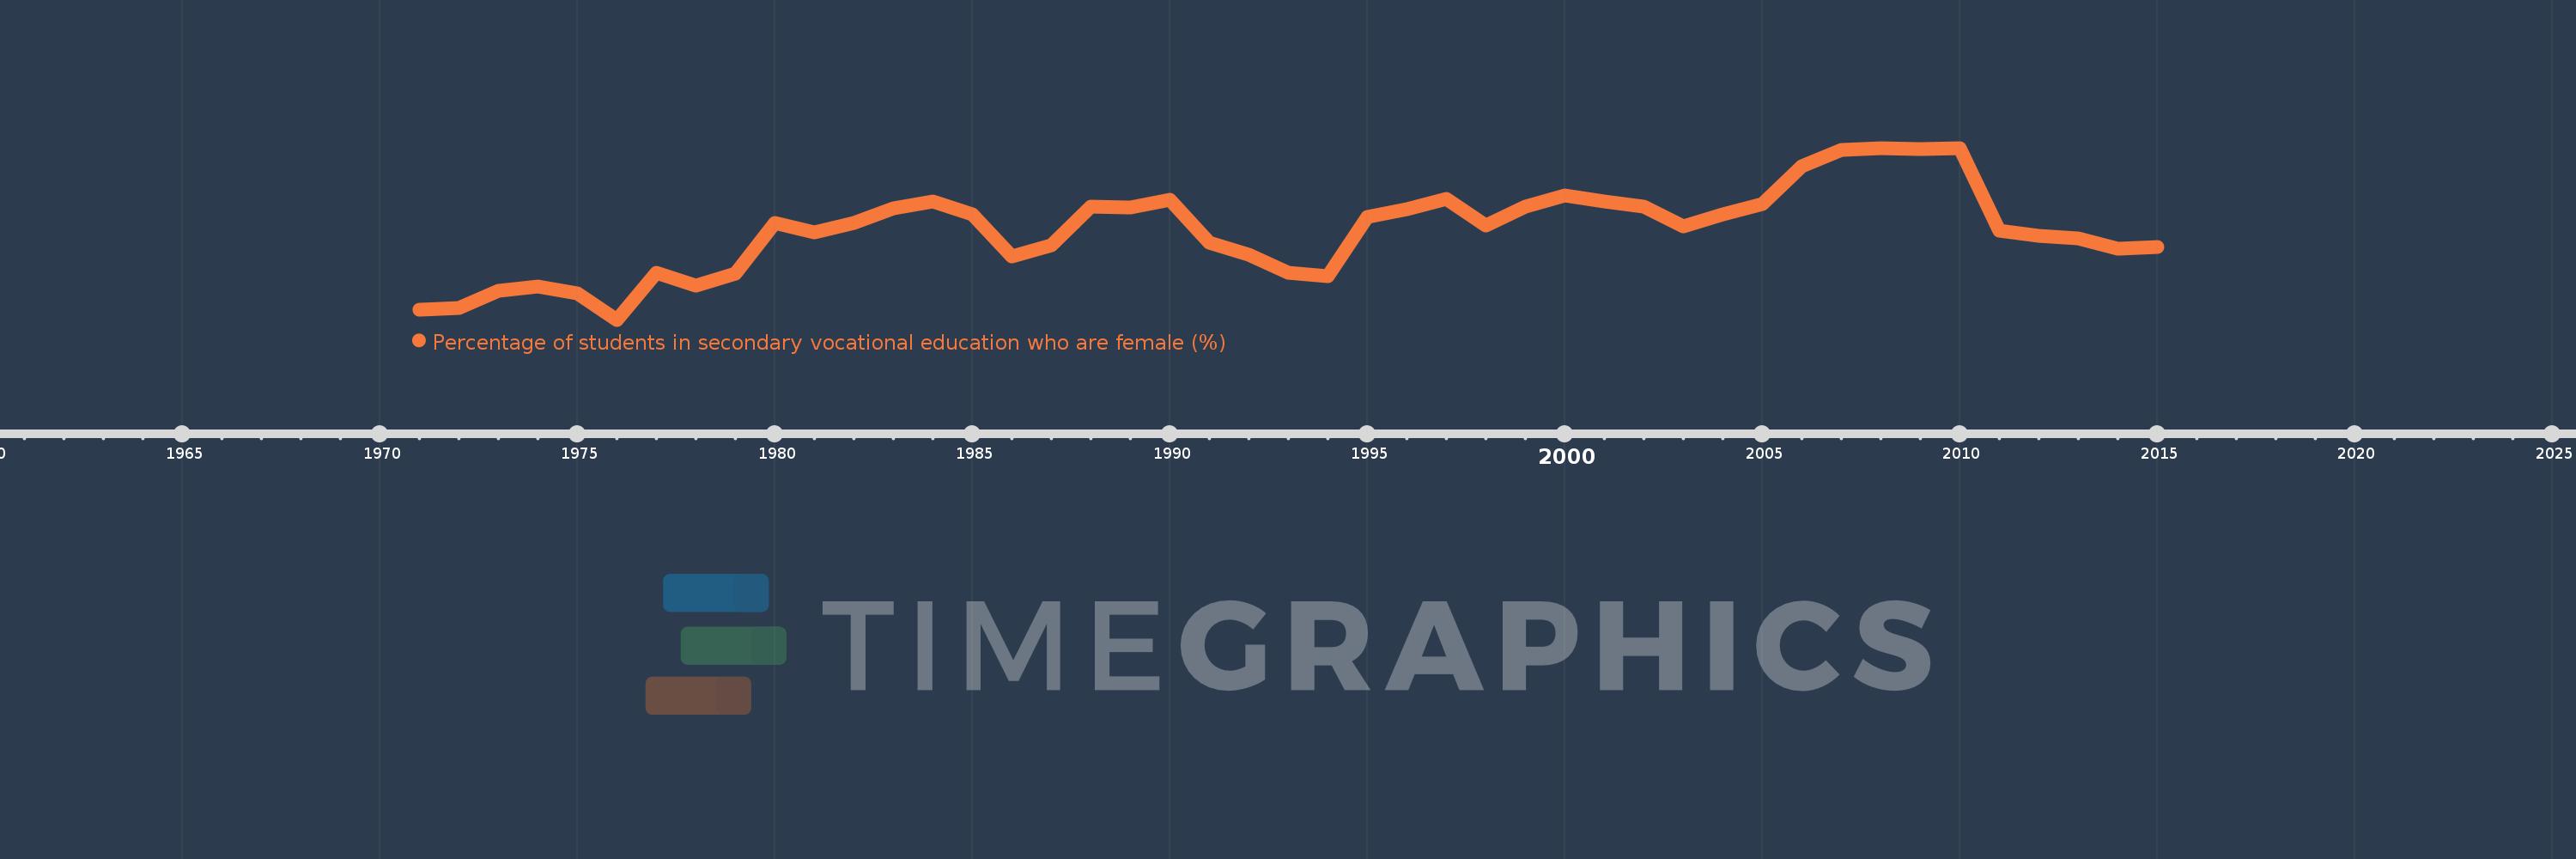
Percentage of students in secondary vocational education who are female (%)
2015,2014,2013,2012,2011,2010,2009,2008,2007,2006,2005,2004,2003,2002,2001,2000,1999,1998,1997,1996,1995,1994,1993,1992,1991,1990,1989,1988,1987,1986,1985,1984,1983,1982,1981,1980,1979,1978,1977,1976,1975,1974,1973,1972,1971
Estas estadísticas en otros países:
AfghanistanAlbaniaAlgeriaAndorraAngolaAntigua and BarbudaArab WorldArgentinaArmeniaArubaAustraliaAustriaAzerbaijanBahrainBangladeshBarbadosBelarusBelgiumBelizeBeninBermudaBhutanBoliviaBosnia and HerzegovinaBotswanaBrazilBritish Virgin IslandsBrunei DarussalamBulgariaBurkina FasoBurundiCabo VerdeCambodiaCameroonCanadaCaribbean small statesCentral African RepublicCentral Europe and the BalticsChadChileChinaColombiaComorosCongo, Dem. Rep.Congo, Rep.Costa RicaCote d'IvoireCroatiaCubaCuracaoCyprusCzech RepublicDenmarkDjiboutiDominicaDominican RepublicEarly-demographic dividendEast Asia & PacificEast Asia & Pacific (excluding high income)East Asia & Pacific (IDA & IBRD countries)EcuadorEgypt, Arab Rep.El SalvadorEquatorial GuineaEritreaEstoniaEthiopiaEuro areaEurope & Central AsiaEurope & Central Asia (excluding high income)Europe & Central Asia (IDA & IBRD countries)European UnionFijiFinlandFragile and conflict affected situationsFranceGabonGambia, TheGeorgiaGermanyGhanaGibraltarGreeceGrenadaGuatemalaGuineaGuinea-BissauGuyanaHaitiHeavily indebted poor countries (HIPC)High incomeHondurasHong Kong SAR, ChinaHungaryIBRD onlyIcelandIDA & IBRD totalIDA blendIDA onlyIDA totalIndiaIndonesiaIran, Islamic Rep.IraqIrelandIsraelItalyJamaicaJapanJordanKazakhstanKenyaKiribatiKorea, Rep.KuwaitKyrgyz RepublicLao PDRLate-demographic dividendLatin America & Caribbean Latin America & Caribbean (excluding high income)Latin America & the Caribbean (IDA & IBRD countries)LatviaLeast developed countries: UN classificationLebanonLesothoLiberiaLibyaLiechtensteinLithuaniaLow & middle incomeLow incomeLower middle incomeLuxembourgMacao SAR, ChinaMacedonia, FYRMadagascarMalawiMalaysiaMaldivesMaliMaltaMarshall IslandsMauritaniaMauritiusMexicoMicronesia, Fed. Sts.Middle East & North AfricaMiddle East & North Africa (excluding high income)Middle East & North Africa (IDA & IBRD countries)Middle incomeMoldovaMonacoMongoliaMontenegroMoroccoMozambiqueMyanmarNamibiaNauruNepalNetherlandsNew ZealandNicaraguaNigerNigeriaNorth AmericaNorwayOECD membersOmanOther small statesPacific island small statesPakistanPanamaPapua New GuineaParaguayPeruPolandPortugalPost-demographic dividendPre-demographic dividendPuerto RicoQatarRomaniaRussian FederationRwandaSamoaSan MarinoSao Tome and PrincipeSaudi ArabiaSenegalSerbiaSeychellesSierra LeoneSingaporeSint Maarten (Dutch part)Slovak RepublicSloveniaSmall statesSolomon IslandsSomaliaSouth AfricaSouth AsiaSouth Asia (IDA & IBRD)SpainSri LankaSt. Kitts and NevisSt. LuciaSt. Vincent and the GrenadinesSub-Saharan Africa Sub-Saharan Africa (excluding high income)Sub-Saharan Africa (IDA & IBRD countries)SudanSurinameSwazilandSwedenSwitzerlandSyrian Arab RepublicTajikistanTanzaniaThailandTimor-LesteTogoTongaTrinidad and TobagoTunisiaTurkeyTurkmenistanTurks and Caicos IslandsTuvaluUgandaUkraineUnited Arab EmiratesUnited KingdomUpper middle incomeUruguayUzbekistanVanuatuVenezuela, RBVietnamWest Bank and GazaWorldYemen, Rep.ZambiaZimbabwe línea de tiempo (timeline):
En esta escala de tiempo se presenta un gráfico de 1971 y 2015 de Low & middle income. Los datos de 1970 están ausentes. El número de observaciones reales por fecha: 45.
Fuente (nombre):
Indicadores del desarrollo mundial
Fuente (organización):
UNESCO Institute for Statistics
Categorías:
Education, Gender
Se ha actualizado:
23 abr 2017 año
Los indicadores de los cambios de valor en los últimos años
Mínimo:
41.26
1 ene 1976 año
Máximo:
46.203
1 ene 2008 año
A la fecha de observación
Valor
Cambio absoluto
El cambio con respecto al valor anterior
1 ene 1971 año
41.541
+41.541
0.0%
1 ene 1972 año
41.587
+0.046
0.11%
1 ene 1973 año
42.094
+0.508
1.22%
1 ene 1974 año
42.221
+0.127
0.3%
1 ene 1975 año
42.025
-0.196
-0.46%
1 ene 1976 año
41.26
-0.766
-1.82%
1 ene 1977 año
42.603
+1.343
3.25%
1 ene 1978 año
42.247
-0.356
-0.84%
1 ene 1979 año
42.593
+0.347
0.82%
1 ene 1980 año
44.052
+1.458
3.42%
1 ene 1981 año
43.782
-0.27
-0.61%
1 ene 1982 año
44.034
+0.252
0.58%
1 ene 1983 año
44.454
+0.42
0.95%
1 ene 1984 año
44.668
+0.215
0.48%
1 ene 1985 año
44.297
-0.371
-0.83%
1 ene 1986 año
43.082
-1.215
-2.74%
1 ene 1987 año
43.408
+0.326
0.76%
1 ene 1988 año
44.513
+1.105
2.55%
1 ene 1989 año
44.5
-0.014
-0.03%
1 ene 1990 año
44.711
+0.212
0.48%
1 ene 1991 año
43.483
-1.228
-2.75%
1 ene 1992 año
43.126
-0.358
-0.82%
1 ene 1993 año
42.614
-0.512
-1.19%
1 ene 1994 año
42.508
-0.106
-0.25%
1 ene 1995 año
44.207
+1.699
4.0%
1 ene 1996 año
44.433
+0.226
0.51%
1 ene 1997 año
44.746
+0.313
0.7%
1 ene 1998 año
43.976
-0.77
-1.72%
1 ene 1999 año
44.526
+0.55
1.25%
1 ene 2000 año
44.828
+0.302
0.68%
1 ene 2001 año
44.651
-0.177
-0.4%
1 ene 2002 año
44.521
-0.131
-0.29%
1 ene 2003 año
43.94
-0.581
-1.3%
1 ene 2004 año
44.293
+0.353
0.8%
1 ene 2005 año
44.598
+0.305
0.69%
1 ene 2006 año
45.67
+1.072
2.4%
1 ene 2007 año
46.139
+0.469
1.03%
1 ene 2008 año
46.203
+0.064
0.14%
1 ene 2009 año
46.164
-0.039
-0.08%
1 ene 2010 año
46.191
+0.026
0.06%
1 ene 2011 año
43.826
-2.365
-5.12%
1 ene 2012 año
43.679
-0.147
-0.34%
1 ene 2013 año
43.597
-0.082
-0.19%
1 ene 2014 año
43.302
-0.295
-0.68%
1 ene 2015 año
43.355
+0.053
0.12%
Ranking de los países por los datos estadísticos actuales


Comentarios: