29
/es/
es
AIzaSyAYiBZKx7MnpbEhh9jyipgxe19OcubqV5w
April 1, 2024
209664
New Zealand
NZL
true
2
1
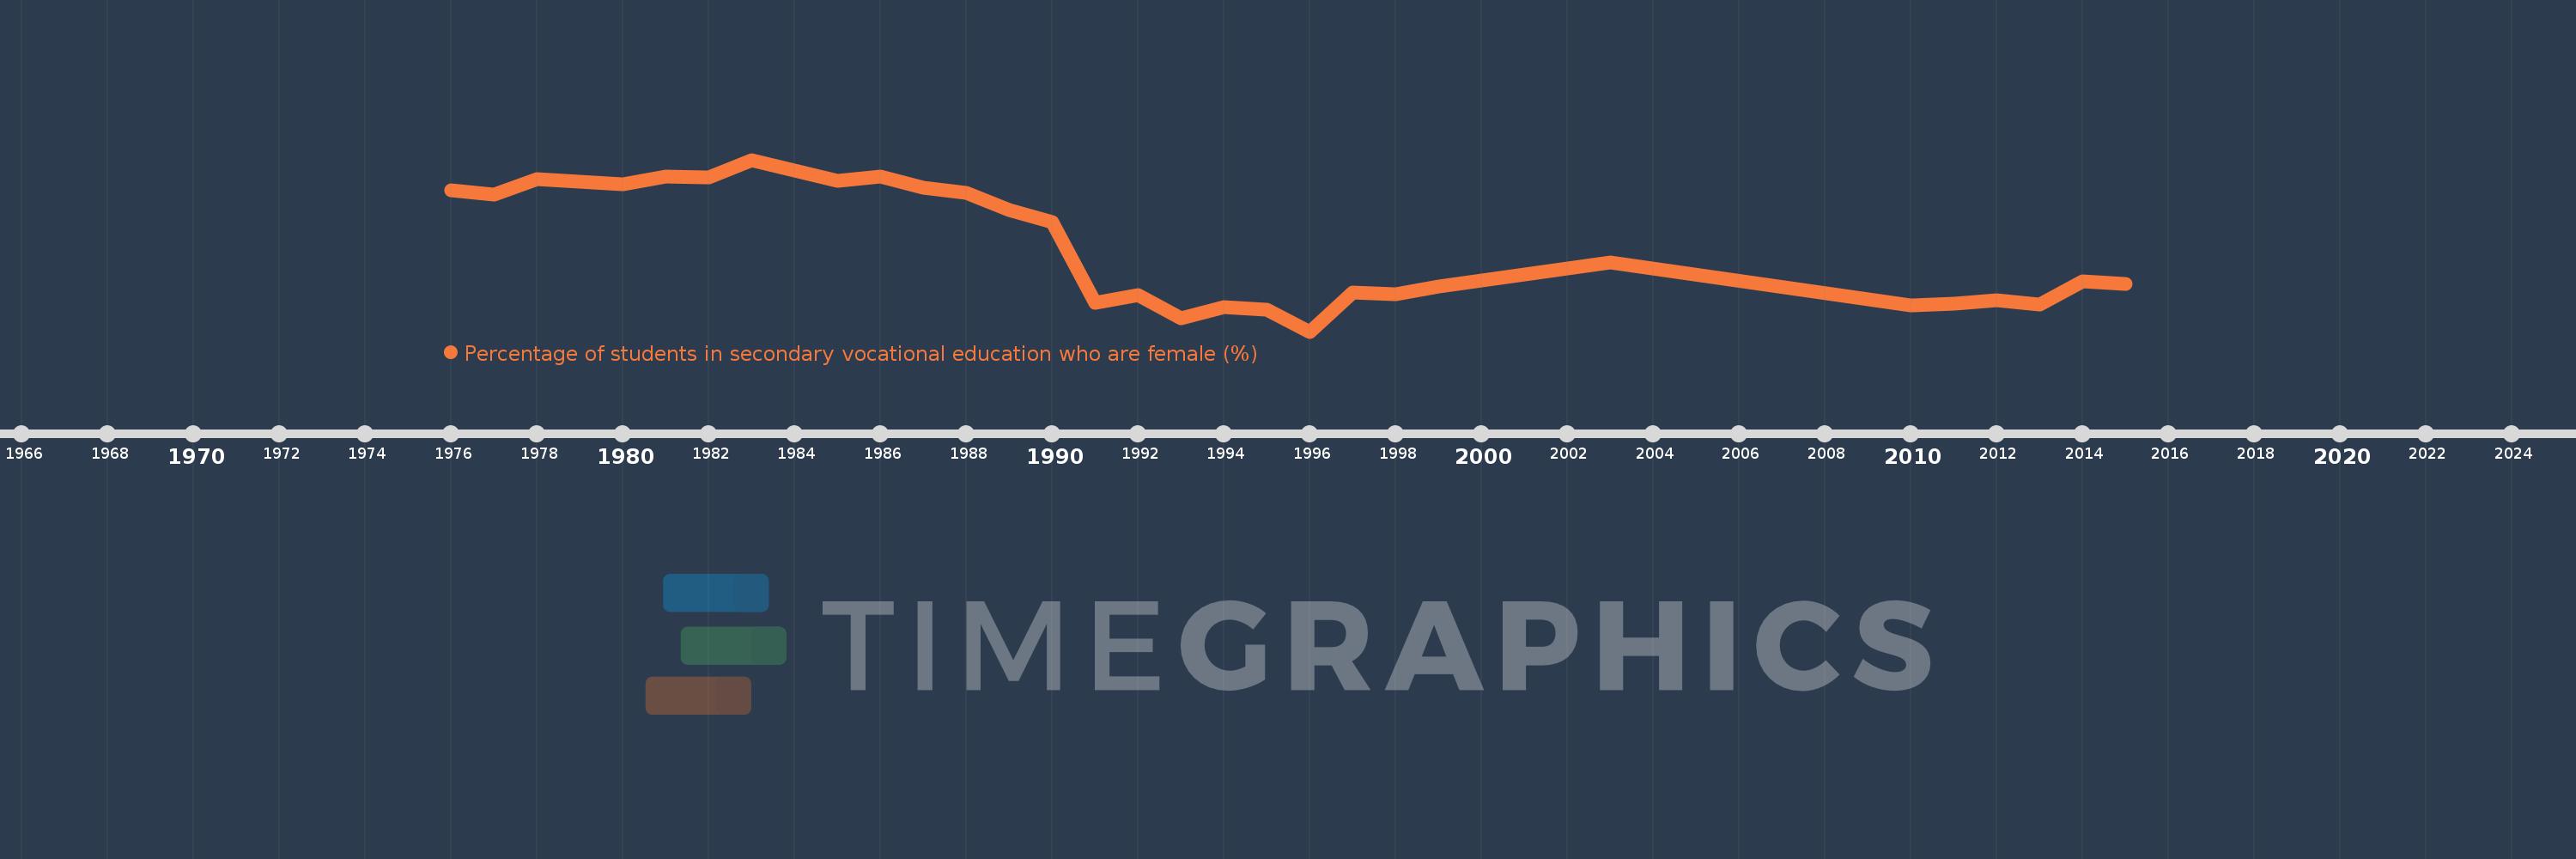
Percentage of students in secondary vocational education who are female (%)
2015,2014,2013,2012,2011,2010,2003,1999,1998,1997,1996,1995,1994,1993,1992,1991,1990,1989,1988,1987,1986,1985,1984,1983,1982,1981,1980,1978,1977,1976
Estas estadísticas en otros países:
AfghanistanAlbaniaAlgeriaAndorraAngolaAntigua and BarbudaArab WorldArgentinaArmeniaArubaAustraliaAustriaAzerbaijanBahrainBangladeshBarbadosBelarusBelgiumBelizeBeninBermudaBhutanBoliviaBosnia and HerzegovinaBotswanaBrazilBritish Virgin IslandsBrunei DarussalamBulgariaBurkina FasoBurundiCabo VerdeCambodiaCameroonCanadaCaribbean small statesCentral African RepublicCentral Europe and the BalticsChadChileChinaColombiaComorosCongo, Dem. Rep.Congo, Rep.Costa RicaCote d'IvoireCroatiaCubaCuracaoCyprusCzech RepublicDenmarkDjiboutiDominicaDominican RepublicEarly-demographic dividendEast Asia & PacificEast Asia & Pacific (excluding high income)East Asia & Pacific (IDA & IBRD countries)EcuadorEgypt, Arab Rep.El SalvadorEquatorial GuineaEritreaEstoniaEthiopiaEuro areaEurope & Central AsiaEurope & Central Asia (excluding high income)Europe & Central Asia (IDA & IBRD countries)European UnionFijiFinlandFragile and conflict affected situationsFranceGabonGambia, TheGeorgiaGermanyGhanaGibraltarGreeceGrenadaGuatemalaGuineaGuinea-BissauGuyanaHaitiHeavily indebted poor countries (HIPC)High incomeHondurasHong Kong SAR, ChinaHungaryIBRD onlyIcelandIDA & IBRD totalIDA blendIDA onlyIDA totalIndiaIndonesiaIran, Islamic Rep.IraqIrelandIsraelItalyJamaicaJapanJordanKazakhstanKenyaKiribatiKorea, Rep.KuwaitKyrgyz RepublicLao PDRLate-demographic dividendLatin America & Caribbean Latin America & Caribbean (excluding high income)Latin America & the Caribbean (IDA & IBRD countries)LatviaLeast developed countries: UN classificationLebanonLesothoLiberiaLibyaLiechtensteinLithuaniaLow & middle incomeLow incomeLower middle incomeLuxembourgMacao SAR, ChinaMacedonia, FYRMadagascarMalawiMalaysiaMaldivesMaliMaltaMarshall IslandsMauritaniaMauritiusMexicoMicronesia, Fed. Sts.Middle East & North AfricaMiddle East & North Africa (excluding high income)Middle East & North Africa (IDA & IBRD countries)Middle incomeMoldovaMonacoMongoliaMontenegroMoroccoMozambiqueMyanmarNamibiaNauruNepalNetherlandsNew ZealandNicaraguaNigerNigeriaNorth AmericaNorwayOECD membersOmanOther small statesPacific island small statesPakistanPanamaPapua New GuineaParaguayPeruPolandPortugalPost-demographic dividendPre-demographic dividendPuerto RicoQatarRomaniaRussian FederationRwandaSamoaSan MarinoSao Tome and PrincipeSaudi ArabiaSenegalSerbiaSeychellesSierra LeoneSingaporeSint Maarten (Dutch part)Slovak RepublicSloveniaSmall statesSolomon IslandsSomaliaSouth AfricaSouth AsiaSouth Asia (IDA & IBRD)SpainSri LankaSt. Kitts and NevisSt. LuciaSt. Vincent and the GrenadinesSub-Saharan Africa Sub-Saharan Africa (excluding high income)Sub-Saharan Africa (IDA & IBRD countries)SudanSurinameSwazilandSwedenSwitzerlandSyrian Arab RepublicTajikistanTanzaniaThailandTimor-LesteTogoTongaTrinidad and TobagoTunisiaTurkeyTurkmenistanTurks and Caicos IslandsTuvaluUgandaUkraineUnited Arab EmiratesUnited KingdomUpper middle incomeUruguayUzbekistanVanuatuVenezuela, RBVietnamWest Bank and GazaWorldYemen, Rep.ZambiaZimbabwe línea de tiempo (timeline):
En esta escala de tiempo se presenta un gráfico de 1976 y 2015 de New Zealand. Los datos de 1975 están ausentes. El número de observaciones reales por fecha: 30.
Fuente (nombre):
Indicadores del desarrollo mundial
Fuente (organización):
UNESCO Institute for Statistics
Categorías:
Education, Gender
Se ha actualizado:
23 abr 2017 año
Los indicadores de los cambios de valor en los últimos años
Mínimo:
41.888
1 ene 1996 año
Máximo:
85.968
1 ene 1983 año
A la fecha de observación
Valor
Cambio absoluto
El cambio con respecto al valor anterior
1 ene 1976 año
78.132
+78.132
0.0%
1 ene 1977 año
77.146
-0.986
-1.26%
1 ene 1978 año
80.938
+3.792
4.92%
1 ene 1980 año
79.678
-1.26
-1.56%
1 ene 1981 año
81.635
+1.957
2.46%
1 ene 1982 año
81.432
-0.203
-0.25%
1 ene 1983 año
85.968
+4.536
5.57%
1 ene 1984 año
83.173
-2.796
-3.25%
1 ene 1985 año
80.663
-2.51
-3.02%
1 ene 1986 año
81.722
+1.059
1.31%
1 ene 1987 año
78.769
-2.953
-3.61%
1 ene 1988 año
77.413
-1.356
-1.72%
1 ene 1989 año
72.984
-4.429
-5.72%
1 ene 1990 año
69.961
-3.023
-4.14%
1 ene 1991 año
49.208
-20.753
-29.66%
1 ene 1992 año
51.232
+2.024
4.11%
1 ene 1993 año
45.366
-5.866
-11.45%
1 ene 1994 año
48.071
+2.705
5.96%
1 ene 1995 año
47.411
-0.66
-1.37%
1 ene 1996 año
41.888
-5.523
-11.65%
1 ene 1997 año
51.814
+9.926
23.7%
1 ene 1998 año
51.447
-0.367
-0.71%
1 ene 1999 año
53.451
+2.004
3.9%
1 ene 2003 año
59.594
+6.143
11.49%
1 ene 2010 año
48.539
-11.055
-18.55%
1 ene 2011 año
49.158
+0.619
1.27%
1 ene 2012 año
49.871
+0.714
1.45%
1 ene 2013 año
48.837
-1.035
-2.07%
1 ene 2014 año
54.701
+5.865
12.01%
1 ene 2015 año
54.041
-0.661
-1.21%
Ranking de los países por los datos estadísticos actuales


Comentarios: