29
/es/
es
AIzaSyAYiBZKx7MnpbEhh9jyipgxe19OcubqV5w
April 1, 2024
164125
Japan
JPN
true
2
1
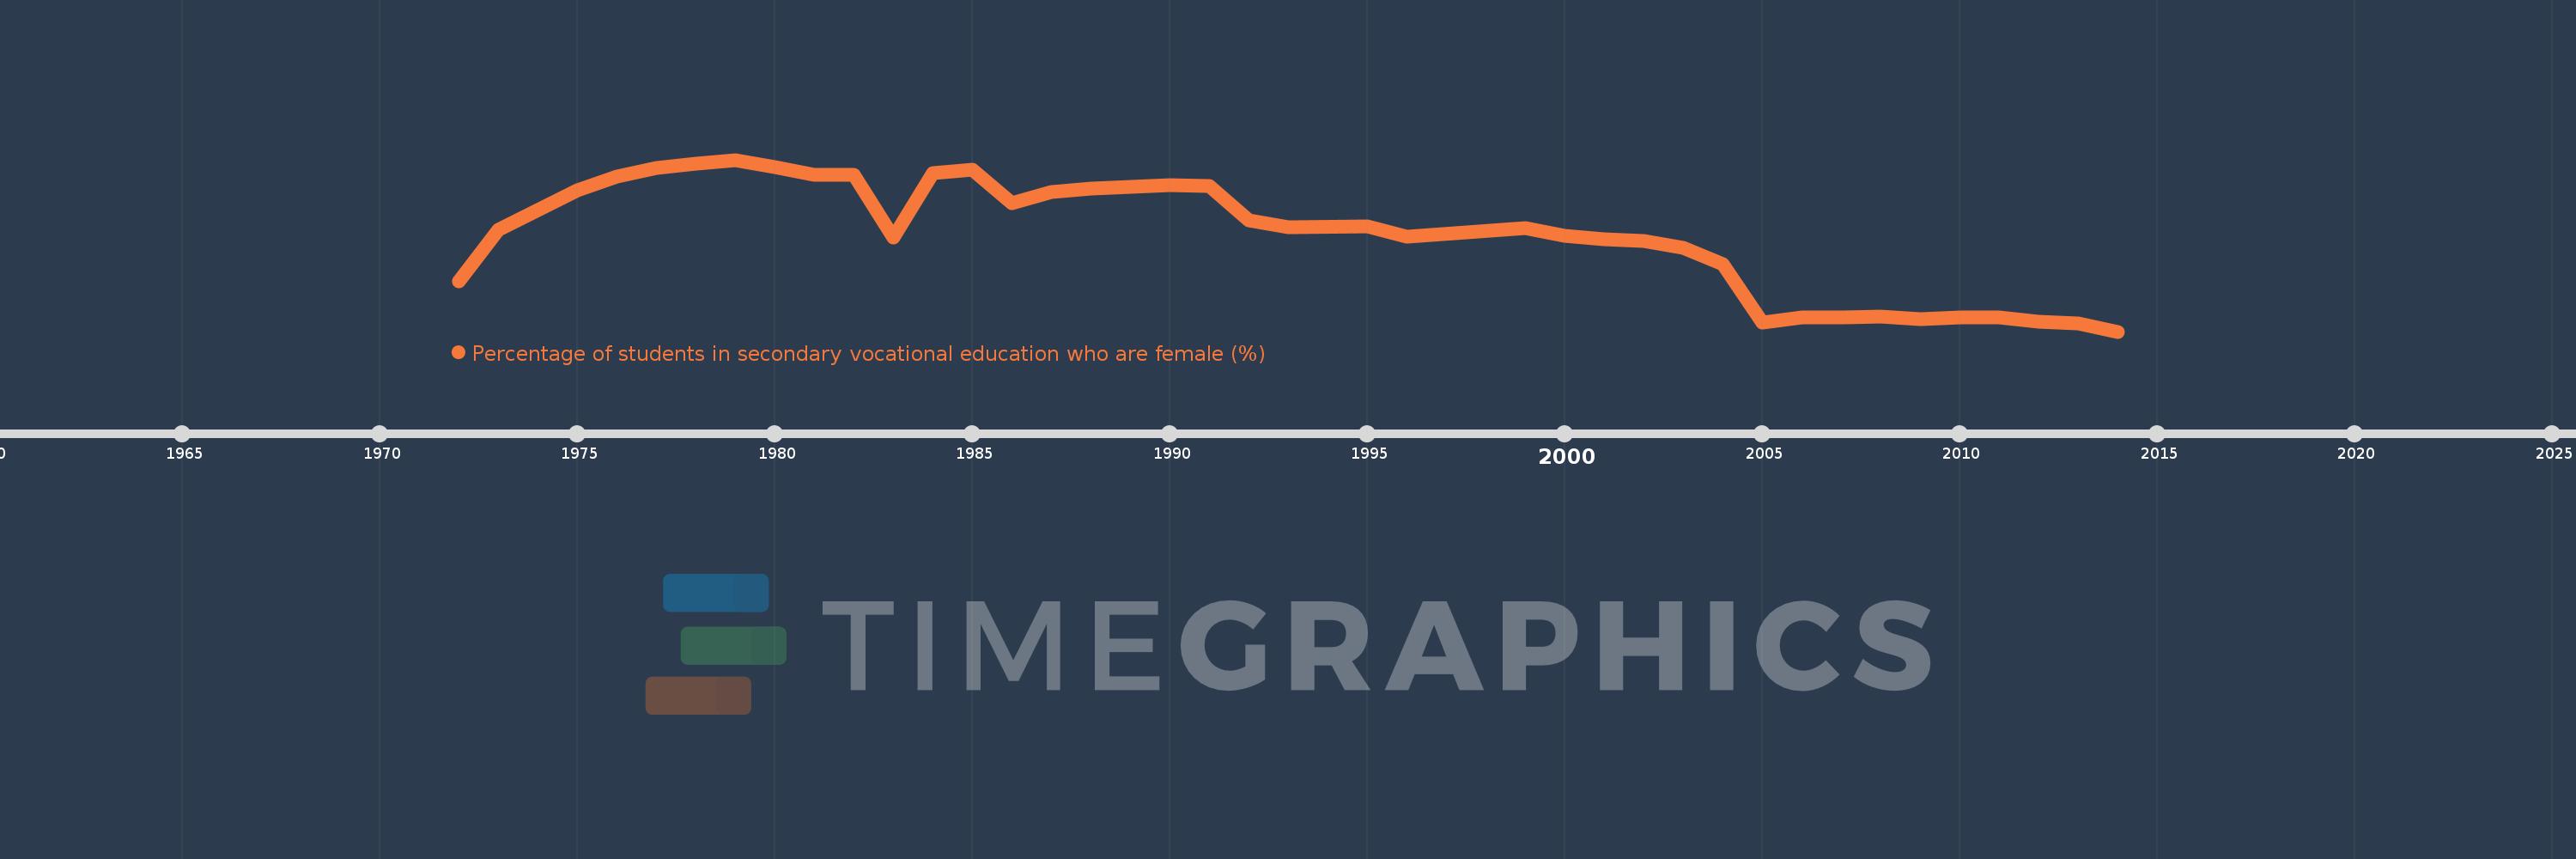
Percentage of students in secondary vocational education who are female (%)
2014,2013,2012,2011,2010,2009,2008,2007,2006,2005,2004,2003,2002,2001,2000,1999,1996,1995,1993,1992,1991,1990,1989,1988,1987,1986,1985,1984,1983,1982,1981,1980,1979,1978,1977,1976,1975,1974,1973,1972
Estas estadísticas en otros países:
AfghanistanAlbaniaAlgeriaAndorraAngolaAntigua and BarbudaArab WorldArgentinaArmeniaArubaAustraliaAustriaAzerbaijanBahrainBangladeshBarbadosBelarusBelgiumBelizeBeninBermudaBhutanBoliviaBosnia and HerzegovinaBotswanaBrazilBritish Virgin IslandsBrunei DarussalamBulgariaBurkina FasoBurundiCabo VerdeCambodiaCameroonCanadaCaribbean small statesCentral African RepublicCentral Europe and the BalticsChadChileChinaColombiaComorosCongo, Dem. Rep.Congo, Rep.Costa RicaCote d'IvoireCroatiaCubaCuracaoCyprusCzech RepublicDenmarkDjiboutiDominicaDominican RepublicEarly-demographic dividendEast Asia & PacificEast Asia & Pacific (excluding high income)East Asia & Pacific (IDA & IBRD countries)EcuadorEgypt, Arab Rep.El SalvadorEquatorial GuineaEritreaEstoniaEthiopiaEuro areaEurope & Central AsiaEurope & Central Asia (excluding high income)Europe & Central Asia (IDA & IBRD countries)European UnionFijiFinlandFragile and conflict affected situationsFranceGabonGambia, TheGeorgiaGermanyGhanaGibraltarGreeceGrenadaGuatemalaGuineaGuinea-BissauGuyanaHaitiHeavily indebted poor countries (HIPC)High incomeHondurasHong Kong SAR, ChinaHungaryIBRD onlyIcelandIDA & IBRD totalIDA blendIDA onlyIDA totalIndiaIndonesiaIran, Islamic Rep.IraqIrelandIsraelItalyJamaicaJapanJordanKazakhstanKenyaKiribatiKorea, Rep.KuwaitKyrgyz RepublicLao PDRLate-demographic dividendLatin America & Caribbean Latin America & Caribbean (excluding high income)Latin America & the Caribbean (IDA & IBRD countries)LatviaLeast developed countries: UN classificationLebanonLesothoLiberiaLibyaLiechtensteinLithuaniaLow & middle incomeLow incomeLower middle incomeLuxembourgMacao SAR, ChinaMacedonia, FYRMadagascarMalawiMalaysiaMaldivesMaliMaltaMarshall IslandsMauritaniaMauritiusMexicoMicronesia, Fed. Sts.Middle East & North AfricaMiddle East & North Africa (excluding high income)Middle East & North Africa (IDA & IBRD countries)Middle incomeMoldovaMonacoMongoliaMontenegroMoroccoMozambiqueMyanmarNamibiaNauruNepalNetherlandsNew ZealandNicaraguaNigerNigeriaNorth AmericaNorwayOECD membersOmanOther small statesPacific island small statesPakistanPanamaPapua New GuineaParaguayPeruPolandPortugalPost-demographic dividendPre-demographic dividendPuerto RicoQatarRomaniaRussian FederationRwandaSamoaSan MarinoSao Tome and PrincipeSaudi ArabiaSenegalSerbiaSeychellesSierra LeoneSingaporeSint Maarten (Dutch part)Slovak RepublicSloveniaSmall statesSolomon IslandsSomaliaSouth AfricaSouth AsiaSouth Asia (IDA & IBRD)SpainSri LankaSt. Kitts and NevisSt. LuciaSt. Vincent and the GrenadinesSub-Saharan Africa Sub-Saharan Africa (excluding high income)Sub-Saharan Africa (IDA & IBRD countries)SudanSurinameSwazilandSwedenSwitzerlandSyrian Arab RepublicTajikistanTanzaniaThailandTimor-LesteTogoTongaTrinidad and TobagoTunisiaTurkeyTurkmenistanTurks and Caicos IslandsTuvaluUgandaUkraineUnited Arab EmiratesUnited KingdomUpper middle incomeUruguayUzbekistanVanuatuVenezuela, RBVietnamWest Bank and GazaWorldYemen, Rep.ZambiaZimbabwe línea de tiempo (timeline):
En esta escala de tiempo se presenta un gráfico de 1972 y 2014 de Japan. Los datos de 1971 están ausentes. El número de observaciones reales por fecha: 40.
Fuente (nombre):
Indicadores del desarrollo mundial
Fuente (organización):
UNESCO Institute for Statistics
Categorías:
Education, Gender
Se ha actualizado:
23 abr 2017 año
Los indicadores de los cambios de valor en los últimos años
Mínimo:
42.709
1 ene 2014 año
Máximo:
47.227
1 ene 1979 año
A la fecha de observación
Valor
Cambio absoluto
El cambio con respecto al valor anterior
1 ene 1972 año
44.02
+44.02
0.0%
1 ene 1973 año
45.381
+1.362
3.09%
1 ene 1974 año
45.898
+0.516
1.14%
1 ene 1975 año
46.433
+0.536
1.17%
1 ene 1976 año
46.796
+0.363
0.78%
1 ene 1977 año
47.017
+0.222
0.47%
1 ene 1978 año
47.123
+0.105
0.22%
1 ene 1979 año
47.227
+0.104
0.22%
1 ene 1980 año
47.039
-0.187
-0.4%
1 ene 1981 año
46.833
-0.207
-0.44%
1 ene 1982 año
46.828
-0.005
-0.01%
1 ene 1983 año
45.182
-1.646
-3.51%
1 ene 1984 año
46.887
+1.704
3.77%
1 ene 1985 año
46.977
+0.091
0.19%
1 ene 1986 año
46.086
-0.892
-1.9%
1 ene 1987 año
46.378
+0.293
0.64%
1 ene 1988 año
46.477
+0.099
0.21%
1 ene 1989 año
46.525
+0.048
0.1%
1 ene 1990 año
46.561
+0.035
0.08%
1 ene 1991 año
46.53
-0.03
-0.07%
1 ene 1992 año
45.635
-0.896
-1.93%
1 ene 1993 año
45.447
-0.188
-0.41%
1 ene 1995 año
45.478
+0.032
0.07%
1 ene 1996 año
45.197
-0.281
-0.62%
1 ene 1999 año
45.431
+0.234
0.52%
1 ene 2000 año
45.23
-0.201
-0.44%
1 ene 2001 año
45.139
-0.092
-0.2%
1 ene 2002 año
45.094
-0.045
-0.1%
1 ene 2003 año
44.905
-0.189
-0.42%
1 ene 2004 año
44.472
-0.433
-0.96%
1 ene 2005 año
42.947
-1.525
-3.43%
1 ene 2006 año
43.075
+0.128
0.3%
1 ene 2007 año
43.08
+0.006
0.01%
1 ene 2008 año
43.11
+0.03
0.07%
1 ene 2009 año
43.03
-0.08
-0.18%
1 ene 2010 año
43.079
+0.049
0.11%
1 ene 2011 año
43.083
+0.004
0.01%
1 ene 2012 año
42.974
-0.109
-0.25%
1 ene 2013 año
42.921
-0.053
-0.12%
1 ene 2014 año
42.709
-0.212
-0.49%
Ranking de los países por los datos estadísticos actuales


Comentarios: