29
/es/
es
AIzaSyAYiBZKx7MnpbEhh9jyipgxe19OcubqV5w
April 1, 2024
52806
OECD members
OED
false
2
1
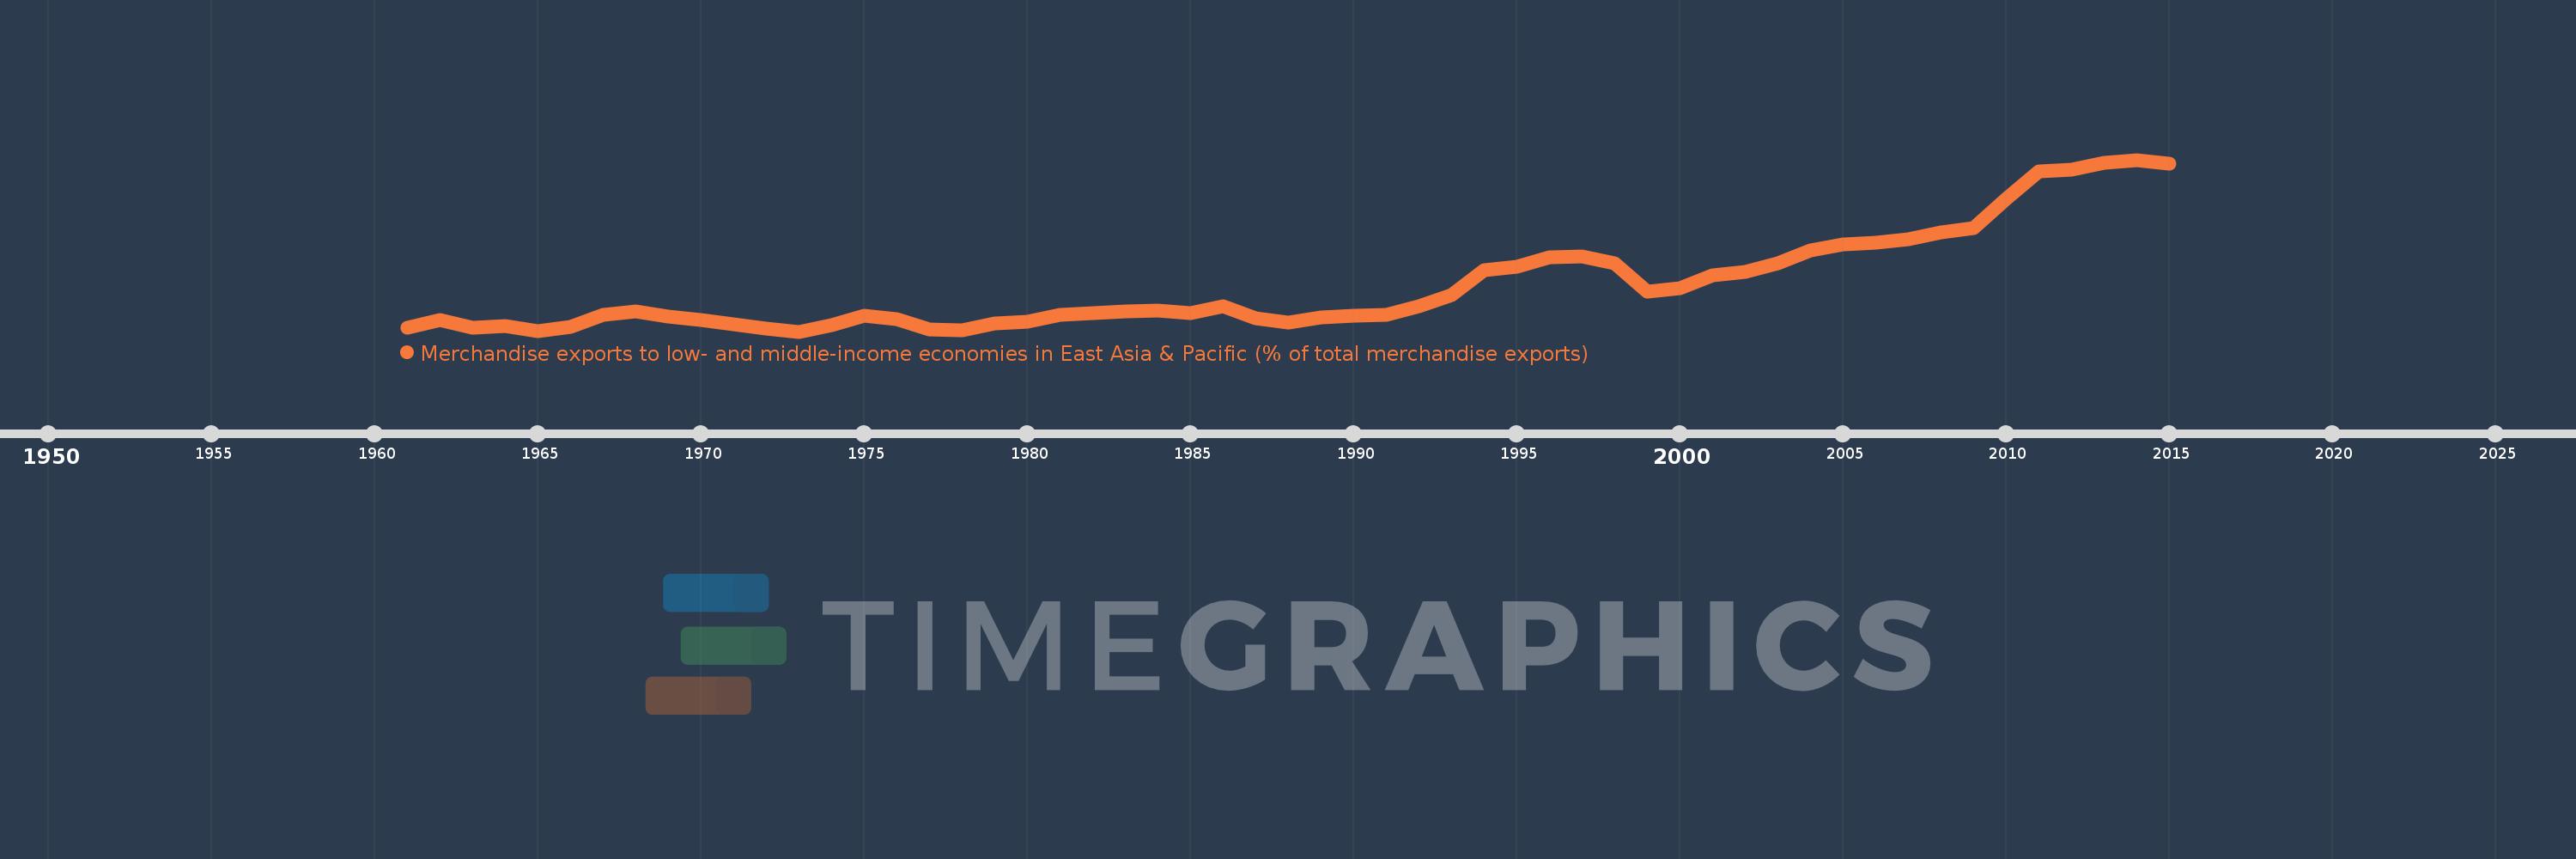
Merchandise exports to low- and middle-income economies in East Asia & Pacific (% of total merchandise exports)
2015,2014,2013,2012,2011,2010,2009,2008,2007,2006,2005,2004,2003,2002,2001,2000,1999,1998,1997,1996,1995,1994,1993,1992,1991,1990,1989,1988,1987,1986,1985,1984,1983,1982,1981,1980,1979,1978,1977,1976,1975,1974,1973,1972,1971,1970,1969,1968,1967,1966,1965,1964,1963,1962,1961
Estas estadísticas en otros países:
AfghanistanAlbaniaAlgeriaArab WorldArgentinaAustraliaAustriaAzerbaijanBahamas, TheBahrainBangladeshBarbadosBelarusBelgiumBermudaBrazilBrunei DarussalamBulgariaCabo VerdeCambodiaCameroonCanadaCaribbean small statesCentral Europe and the BalticsChileChinaColombiaCosta RicaCote d'IvoireCroatiaCubaCyprusCzech RepublicDenmarkDominicaDominican RepublicEarly-demographic dividendEast Asia & PacificEast Asia & Pacific (excluding high income)East Asia & Pacific (IDA & IBRD countries)EcuadorEgypt, Arab Rep.El SalvadorEstoniaEthiopiaEuro areaEurope & Central AsiaEurope & Central Asia (excluding high income)Europe & Central Asia (IDA & IBRD countries)European UnionFijiFinlandFragile and conflict affected situationsFranceGermanyGhanaGreeceGuatemalaGuyanaHeavily indebted poor countries (HIPC)High incomeHondurasHong Kong SAR, ChinaHungaryIBRD onlyIcelandIDA & IBRD totalIDA blendIDA onlyIDA totalIndiaIndonesiaIran, Islamic Rep.IraqIrelandIsraelItalyJamaicaJapanJordanKazakhstanKenyaKorea, Dem. People’s Rep.Korea, Rep.KuwaitLate-demographic dividendLatin America & Caribbean Latin America & Caribbean (excluding high income)Latin America & the Caribbean (IDA & IBRD countries)LatviaLeast developed countries: UN classificationLebanonLithuaniaLow & middle incomeLow incomeLower middle incomeLuxembourgMacao SAR, ChinaMacedonia, FYRMadagascarMalaysiaMaltaMauritiusMexicoMiddle East & North AfricaMiddle East & North Africa (excluding high income)Middle East & North Africa (IDA & IBRD countries)Middle incomeMoldovaMontenegroMoroccoMozambiqueMyanmarNetherlandsNew CaledoniaNew ZealandNigeriaNorth AmericaNorwayOECD membersOmanOther small statesPacific island small statesPakistanPapua New GuineaParaguayPeruPhilippinesPolandPortugalPost-demographic dividendPre-demographic dividendQatarRomaniaRussian FederationSaudi ArabiaSenegalSerbiaSingaporeSlovak RepublicSloveniaSmall statesSolomon IslandsSomaliaSouth AfricaSouth AsiaSouth Asia (IDA & IBRD)SpainSri LankaSt. LuciaSub-Saharan Africa Sub-Saharan Africa (excluding high income)Sub-Saharan Africa (IDA & IBRD countries)SurinameSwedenSwitzerlandSyrian Arab RepublicTanzaniaThailandTogoTongaTrinidad and TobagoTunisiaTurkeyUgandaUkraineUnited Arab EmiratesUnited KingdomUnited StatesUpper middle incomeVenezuela, RBVietnamWorldYemen, Rep.ZambiaZimbabwe línea de tiempo (timeline):
En esta escala de tiempo se presenta un gráfico de 1961 y 2015 de OECD members. Los datos de 1960 están ausentes. El número de observaciones reales por fecha: 55.
Fuente (nombre):
Indicadores del desarrollo mundial
Fuente (organización):
World Bank staff estimates based data from International Monetary Fund's Direction of Trade database.
Categorías:
Private Sector, Trade
Se ha actualizado:
23 abr 2017 año
Los indicadores de los cambios de valor en los últimos años
Mínimo:
2.482
1 ene 1973 año
Máximo:
9.892
1 ene 2014 año
A la fecha de observación
Valor
Cambio absoluto
El cambio con respecto al valor anterior
1 ene 1961 año
2.645
+2.645
0.0%
1 ene 1962 año
2.978
+0.333
12.57%
1 ene 1963 año
2.646
-0.332
-11.15%
1 ene 1964 año
2.709
+0.063
2.4%
1 ene 1965 año
2.489
-0.22
-8.14%
1 ene 1966 año
2.703
+0.214
8.61%
1 ene 1967 año
3.203
+0.5
18.5%
1 ene 1968 año
3.37
+0.167
5.21%
1 ene 1969 año
3.14
-0.23
-6.83%
1 ene 1970 año
2.973
-0.167
-5.31%
1 ene 1971 año
2.784
-0.189
-6.36%
1 ene 1972 año
2.594
-0.19
-6.83%
1 ene 1973 año
2.482
-0.112
-4.31%
1 ene 1974 año
2.747
+0.265
10.66%
1 ene 1975 año
3.171
+0.424
15.43%
1 ene 1976 año
3.005
-0.165
-5.21%
1 ene 1977 año
2.564
-0.441
-14.69%
1 ene 1978 año
2.523
-0.041
-1.6%
1 ene 1979 año
2.829
+0.306
12.13%
1 ene 1980 año
2.913
+0.084
2.98%
1 ene 1981 año
3.223
+0.31
10.65%
1 ene 1982 año
3.292
+0.068
2.12%
1 ene 1983 año
3.342
+0.05
1.52%
1 ene 1984 año
3.405
+0.063
1.88%
1 ene 1985 año
3.28
-0.125
-3.68%
1 ene 1986 año
3.593
+0.313
9.55%
1 ene 1987 año
3.072
-0.521
-14.51%
1 ene 1988 año
2.857
-0.215
-7.0%
1 ene 1989 año
3.083
+0.226
7.92%
1 ene 1990 año
3.183
+0.1
3.23%
1 ene 1991 año
3.209
+0.026
0.82%
1 ene 1992 año
3.589
+0.38
11.86%
1 ene 1993 año
4.062
+0.473
13.18%
1 ene 1994 año
5.116
+1.054
25.95%
1 ene 1995 año
5.274
+0.158
3.08%
1 ene 1996 año
5.686
+0.412
7.81%
1 ene 1997 año
5.731
+0.045
0.8%
1 ene 1998 año
5.439
-0.292
-5.1%
1 ene 1999 año
4.2
-1.239
-22.79%
1 ene 2000 año
4.341
+0.141
3.37%
1 ene 2001 año
4.926
+0.585
13.49%
1 ene 2002 año
5.043
+0.117
2.37%
1 ene 2003 año
5.435
+0.392
7.77%
1 ene 2004 año
5.98
+0.545
10.04%
1 ene 2005 año
6.253
+0.272
4.55%
1 ene 2006 año
6.332
+0.079
1.27%
1 ene 2007 año
6.472
+0.14
2.2%
1 ene 2008 año
6.749
+0.278
4.29%
1 ene 2009 año
6.955
+0.205
3.04%
1 ene 2010 año
8.218
+1.263
18.16%
1 ene 2011 año
9.394
+1.176
14.31%
1 ene 2012 año
9.477
+0.083
0.89%
1 ene 2013 año
9.762
+0.285
3.01%
1 ene 2014 año
9.892
+0.13
1.33%
1 ene 2015 año
9.733
-0.159
-1.61%
Ranking de los países por los datos estadísticos actuales


Comentarios: