29
/es/
es
AIzaSyAYiBZKx7MnpbEhh9jyipgxe19OcubqV5w
April 1, 2024
51115
Middle income
MIC
false
2
1
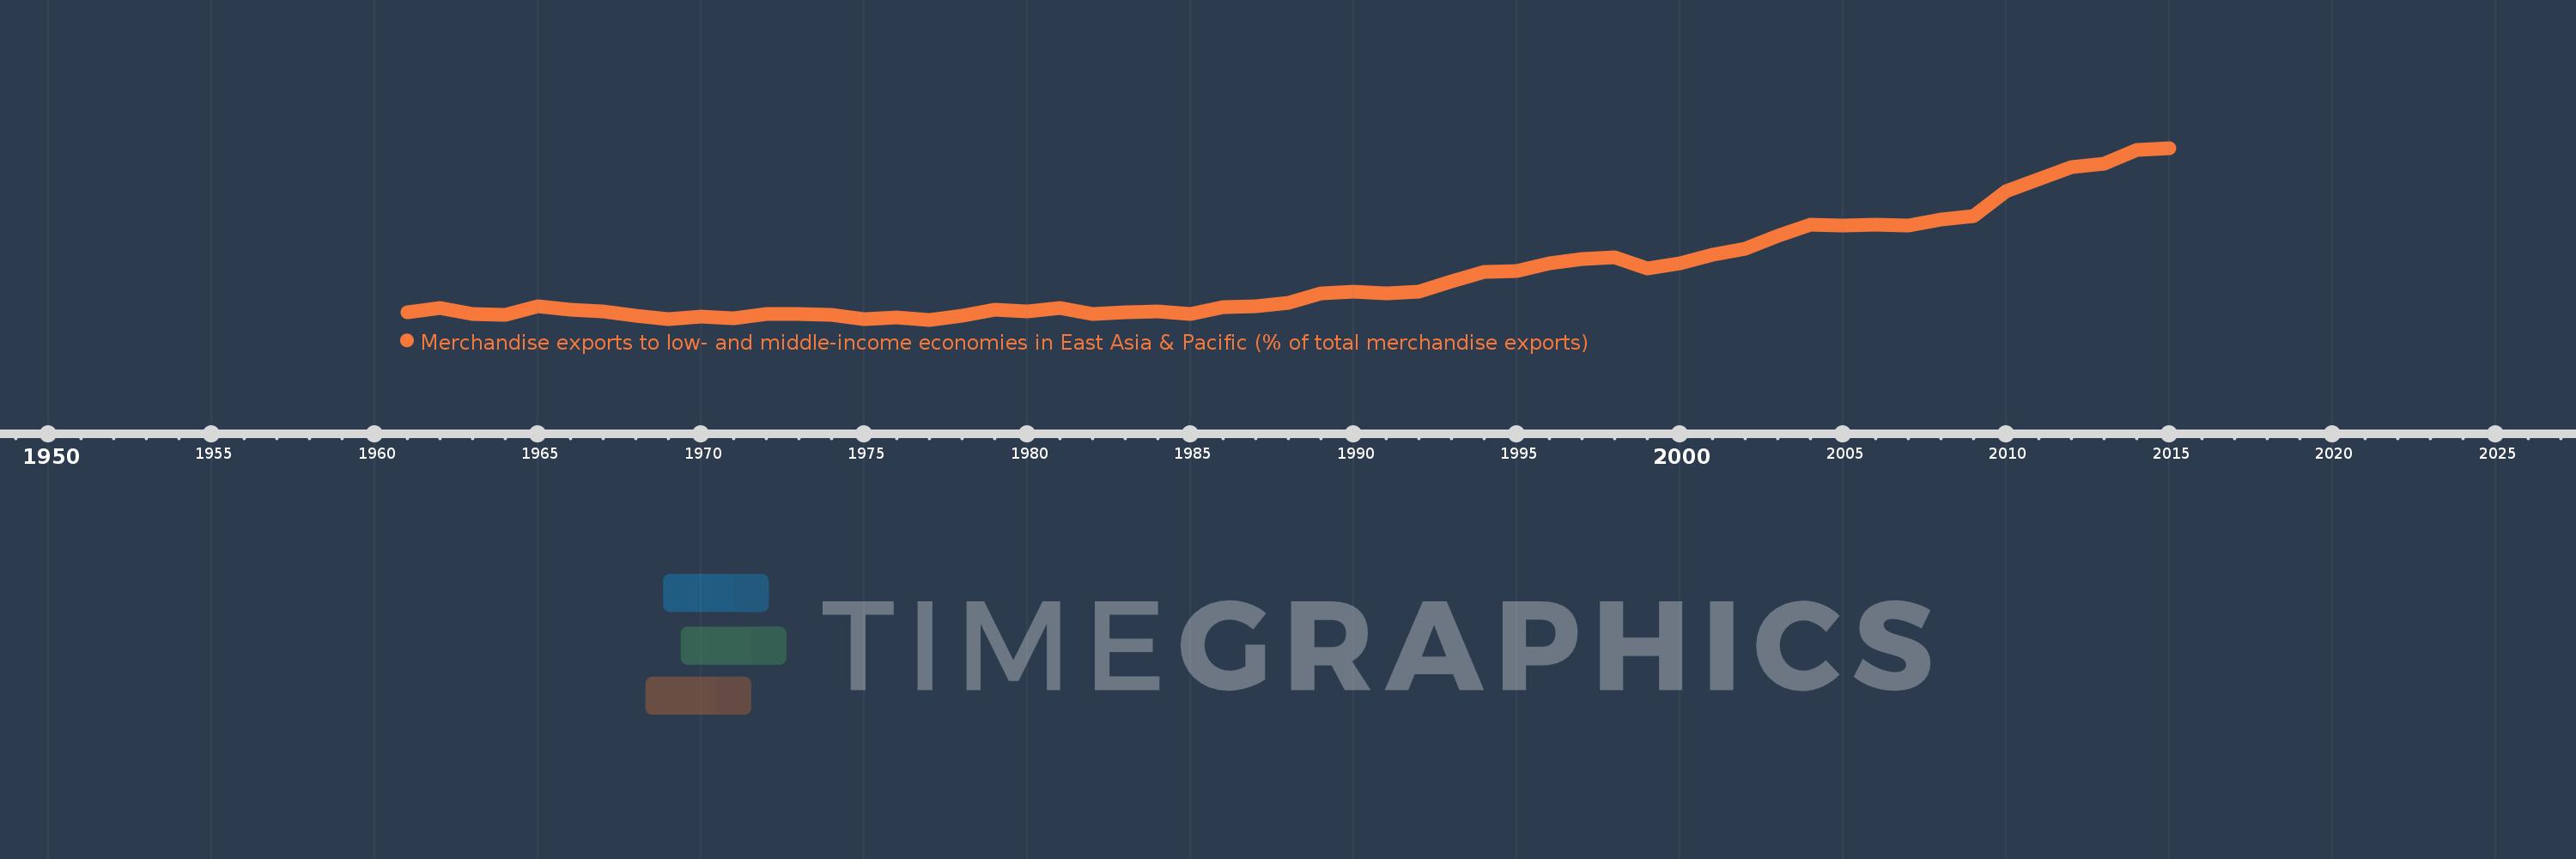
Merchandise exports to low- and middle-income economies in East Asia & Pacific (% of total merchandise exports)
2015,2014,2013,2012,2011,2010,2009,2008,2007,2006,2005,2004,2003,2002,2001,2000,1999,1998,1997,1996,1995,1994,1993,1992,1991,1990,1989,1988,1987,1986,1985,1984,1983,1982,1981,1980,1979,1978,1977,1976,1975,1974,1973,1972,1971,1970,1969,1968,1967,1966,1965,1964,1963,1962,1961
Estas estadísticas en otros países:
AfghanistanAlbaniaAlgeriaArab WorldArgentinaAustraliaAustriaAzerbaijanBahamas, TheBahrainBangladeshBarbadosBelarusBelgiumBermudaBrazilBrunei DarussalamBulgariaCabo VerdeCambodiaCameroonCanadaCaribbean small statesCentral Europe and the BalticsChileChinaColombiaCosta RicaCote d'IvoireCroatiaCubaCyprusCzech RepublicDenmarkDominicaDominican RepublicEarly-demographic dividendEast Asia & PacificEast Asia & Pacific (excluding high income)East Asia & Pacific (IDA & IBRD countries)EcuadorEgypt, Arab Rep.El SalvadorEstoniaEthiopiaEuro areaEurope & Central AsiaEurope & Central Asia (excluding high income)Europe & Central Asia (IDA & IBRD countries)European UnionFijiFinlandFragile and conflict affected situationsFranceGermanyGhanaGreeceGuatemalaGuyanaHeavily indebted poor countries (HIPC)High incomeHondurasHong Kong SAR, ChinaHungaryIBRD onlyIcelandIDA & IBRD totalIDA blendIDA onlyIDA totalIndiaIndonesiaIran, Islamic Rep.IraqIrelandIsraelItalyJamaicaJapanJordanKazakhstanKenyaKorea, Dem. People’s Rep.Korea, Rep.KuwaitLate-demographic dividendLatin America & Caribbean Latin America & Caribbean (excluding high income)Latin America & the Caribbean (IDA & IBRD countries)LatviaLeast developed countries: UN classificationLebanonLithuaniaLow & middle incomeLow incomeLower middle incomeLuxembourgMacao SAR, ChinaMacedonia, FYRMadagascarMalaysiaMaltaMauritiusMexicoMiddle East & North AfricaMiddle East & North Africa (excluding high income)Middle East & North Africa (IDA & IBRD countries)Middle incomeMoldovaMontenegroMoroccoMozambiqueMyanmarNetherlandsNew CaledoniaNew ZealandNigeriaNorth AmericaNorwayOECD membersOmanOther small statesPacific island small statesPakistanPapua New GuineaParaguayPeruPhilippinesPolandPortugalPost-demographic dividendPre-demographic dividendQatarRomaniaRussian FederationSaudi ArabiaSenegalSerbiaSingaporeSlovak RepublicSloveniaSmall statesSolomon IslandsSomaliaSouth AfricaSouth AsiaSouth Asia (IDA & IBRD)SpainSri LankaSt. LuciaSub-Saharan Africa Sub-Saharan Africa (excluding high income)Sub-Saharan Africa (IDA & IBRD countries)SurinameSwedenSwitzerlandSyrian Arab RepublicTanzaniaThailandTogoTongaTrinidad and TobagoTunisiaTurkeyUgandaUkraineUnited Arab EmiratesUnited KingdomUnited StatesUpper middle incomeVenezuela, RBVietnamWorldYemen, Rep.ZambiaZimbabwe línea de tiempo (timeline):
En esta escala de tiempo se presenta un gráfico de 1961 y 2015 de Middle income. Los datos de 1960 están ausentes. El número de observaciones reales por fecha: 55.
Fuente (nombre):
Indicadores del desarrollo mundial
Fuente (organización):
World Bank staff estimates based data from International Monetary Fund's Direction of Trade database.
Categorías:
Private Sector, Trade
Se ha actualizado:
23 abr 2017 año
Los indicadores de los cambios de valor en los últimos años
Mínimo:
1.492
1 ene 1977 año
Máximo:
11.964
1 ene 2015 año
A la fecha de observación
Valor
Cambio absoluto
El cambio con respecto al valor anterior
1 ene 1961 año
1.936
+1.936
0.0%
1 ene 1962 año
2.195
+0.26
13.42%
1 ene 1963 año
1.849
-0.346
-15.78%
1 ene 1964 año
1.793
-0.056
-3.05%
1 ene 1965 año
2.288
+0.496
27.64%
1 ene 1966 año
2.091
-0.197
-8.61%
1 ene 1967 año
2.016
-0.076
-3.61%
1 ene 1968 año
1.723
-0.292
-14.49%
1 ene 1969 año
1.509
-0.214
-12.44%
1 ene 1970 año
1.662
+0.153
10.15%
1 ene 1971 año
1.566
-0.096
-5.77%
1 ene 1972 año
1.852
+0.286
18.25%
1 ene 1973 año
1.847
-0.005
-0.28%
1 ene 1974 año
1.811
-0.036
-1.94%
1 ene 1975 año
1.511
-0.3
-16.57%
1 ene 1976 año
1.611
+0.099
6.58%
1 ene 1977 año
1.492
-0.119
-7.38%
1 ene 1978 año
1.761
+0.269
18.07%
1 ene 1979 año
2.118
+0.357
20.27%
1 ene 1980 año
2.008
-0.11
-5.2%
1 ene 1981 año
2.192
+0.184
9.17%
1 ene 1982 año
1.85
-0.342
-15.6%
1 ene 1983 año
1.939
+0.089
4.8%
1 ene 1984 año
2.01
+0.071
3.67%
1 ene 1985 año
1.865
-0.145
-7.2%
1 ene 1986 año
2.252
+0.387
20.76%
1 ene 1987 año
2.336
+0.083
3.69%
1 ene 1988 año
2.526
+0.191
8.16%
1 ene 1989 año
3.114
+0.588
23.27%
1 ene 1990 año
3.197
+0.083
2.66%
1 ene 1991 año
3.113
-0.084
-2.63%
1 ene 1992 año
3.198
+0.085
2.74%
1 ene 1993 año
3.821
+0.623
19.48%
1 ene 1994 año
4.409
+0.588
15.39%
1 ene 1995 año
4.442
+0.032
0.73%
1 ene 1996 año
4.931
+0.49
11.03%
1 ene 1997 año
5.209
+0.278
5.63%
1 ene 1998 año
5.305
+0.096
1.85%
1 ene 1999 año
4.6
-0.705
-13.29%
1 ene 2000 año
4.942
+0.341
7.42%
1 ene 2001 año
5.478
+0.537
10.86%
1 ene 2002 año
5.842
+0.364
6.65%
1 ene 2003 año
6.618
+0.776
13.28%
1 ene 2004 año
7.29
+0.672
10.15%
1 ene 2005 año
7.255
-0.035
-0.48%
1 ene 2006 año
7.282
+0.027
0.37%
1 ene 2007 año
7.213
-0.069
-0.95%
1 ene 2008 año
7.622
+0.409
5.67%
1 ene 2009 año
7.809
+0.187
2.45%
1 ene 2010 año
9.308
+1.499
19.19%
1 ene 2011 año
10.06
+0.753
8.09%
1 ene 2012 año
10.772
+0.712
7.08%
1 ene 2013 año
11.019
+0.247
2.29%
1 ene 2014 año
11.826
+0.807
7.32%
1 ene 2015 año
11.964
+0.138
1.17%
Ranking de los países por los datos estadísticos actuales


Comentarios: