29
/es/
es
AIzaSyAYiBZKx7MnpbEhh9jyipgxe19OcubqV5w
April 1, 2024
208187
Netherlands
NLD
true
2
1
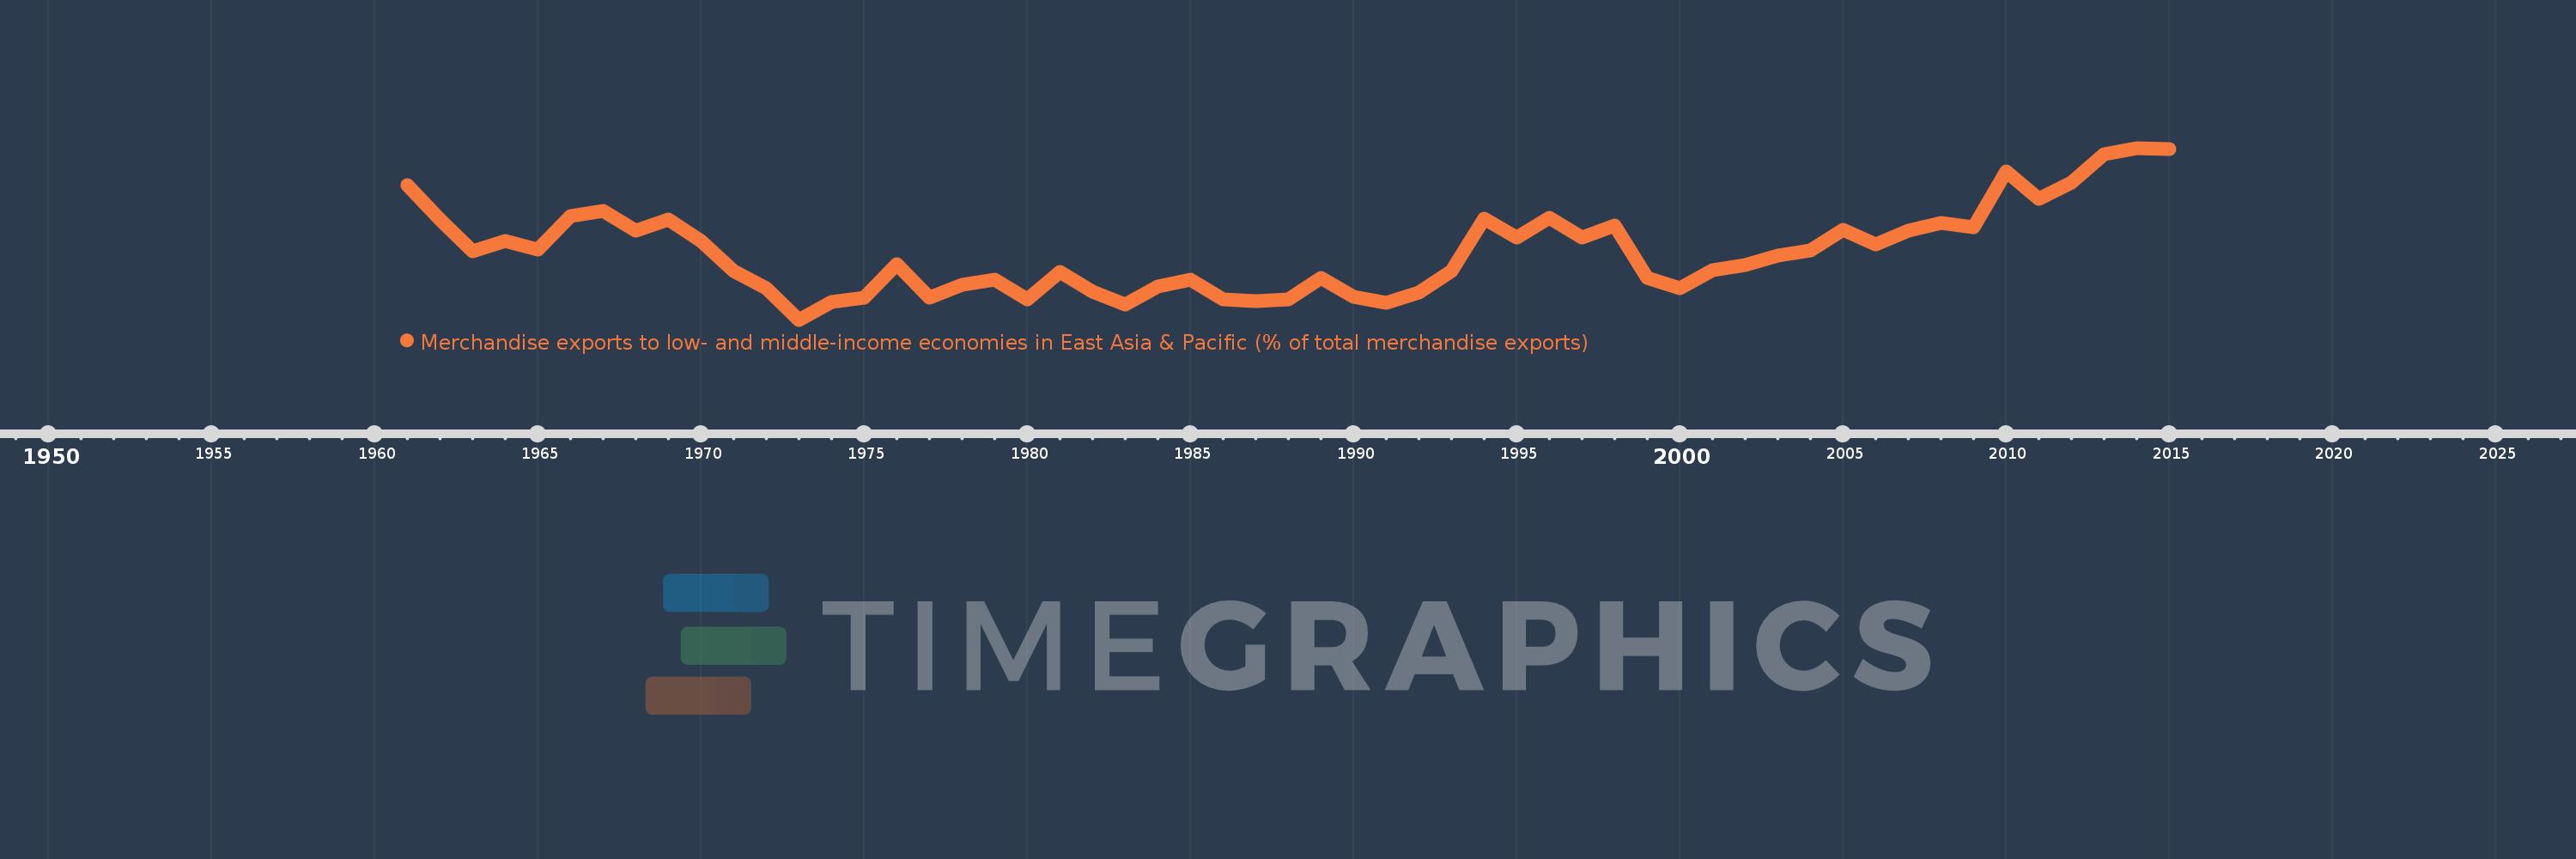
Merchandise exports to low- and middle-income economies in East Asia & Pacific (% of total merchandise exports)
2015,2014,2013,2012,2011,2010,2009,2008,2007,2006,2005,2004,2003,2002,2001,2000,1999,1998,1997,1996,1995,1994,1993,1992,1991,1990,1989,1988,1987,1986,1985,1984,1983,1982,1981,1980,1979,1978,1977,1976,1975,1974,1973,1972,1971,1970,1969,1968,1967,1966,1965,1964,1963,1962,1961
Estas estadísticas en otros países:
AfghanistanAlbaniaAlgeriaArab WorldArgentinaAustraliaAustriaAzerbaijanBahamas, TheBahrainBangladeshBarbadosBelarusBelgiumBermudaBrazilBrunei DarussalamBulgariaCabo VerdeCambodiaCameroonCanadaCaribbean small statesCentral Europe and the BalticsChileChinaColombiaCosta RicaCote d'IvoireCroatiaCubaCyprusCzech RepublicDenmarkDominicaDominican RepublicEarly-demographic dividendEast Asia & PacificEast Asia & Pacific (excluding high income)East Asia & Pacific (IDA & IBRD countries)EcuadorEgypt, Arab Rep.El SalvadorEstoniaEthiopiaEuro areaEurope & Central AsiaEurope & Central Asia (excluding high income)Europe & Central Asia (IDA & IBRD countries)European UnionFijiFinlandFragile and conflict affected situationsFranceGermanyGhanaGreeceGuatemalaGuyanaHeavily indebted poor countries (HIPC)High incomeHondurasHong Kong SAR, ChinaHungaryIBRD onlyIcelandIDA & IBRD totalIDA blendIDA onlyIDA totalIndiaIndonesiaIran, Islamic Rep.IraqIrelandIsraelItalyJamaicaJapanJordanKazakhstanKenyaKorea, Dem. People’s Rep.Korea, Rep.KuwaitLate-demographic dividendLatin America & Caribbean Latin America & Caribbean (excluding high income)Latin America & the Caribbean (IDA & IBRD countries)LatviaLeast developed countries: UN classificationLebanonLithuaniaLow & middle incomeLow incomeLower middle incomeLuxembourgMacao SAR, ChinaMacedonia, FYRMadagascarMalaysiaMaltaMauritiusMexicoMiddle East & North AfricaMiddle East & North Africa (excluding high income)Middle East & North Africa (IDA & IBRD countries)Middle incomeMoldovaMontenegroMoroccoMozambiqueMyanmarNetherlandsNew CaledoniaNew ZealandNigeriaNorth AmericaNorwayOECD membersOmanOther small statesPacific island small statesPakistanPapua New GuineaParaguayPeruPhilippinesPolandPortugalPost-demographic dividendPre-demographic dividendQatarRomaniaRussian FederationSaudi ArabiaSenegalSerbiaSingaporeSlovak RepublicSloveniaSmall statesSolomon IslandsSomaliaSouth AfricaSouth AsiaSouth Asia (IDA & IBRD)SpainSri LankaSt. LuciaSub-Saharan Africa Sub-Saharan Africa (excluding high income)Sub-Saharan Africa (IDA & IBRD countries)SurinameSwedenSwitzerlandSyrian Arab RepublicTanzaniaThailandTogoTongaTrinidad and TobagoTunisiaTurkeyUgandaUkraineUnited Arab EmiratesUnited KingdomUnited StatesUpper middle incomeVenezuela, RBVietnamWorldYemen, Rep.ZambiaZimbabwe línea de tiempo (timeline):
En esta escala de tiempo se presenta un gráfico de 1961 y 2015 de Netherlands. Los datos de 1960 están ausentes. El número de observaciones reales por fecha: 55.
Fuente (nombre):
Indicadores del desarrollo mundial
Fuente (organización):
World Bank staff estimates based data from International Monetary Fund's Direction of Trade database.
Categorías:
Private Sector, Trade
Se ha actualizado:
23 abr 2017 año
Los indicadores de los cambios de valor en los últimos años
Mínimo:
0.724
1 ene 1973 año
Máximo:
2.29
1 ene 2014 año
A la fecha de observación
Valor
Cambio absoluto
El cambio con respecto al valor anterior
1 ene 1961 año
1.952
+1.952
0.0%
1 ene 1962 año
1.634
-0.318
-16.28%
1 ene 1963 año
1.346
-0.288
-17.65%
1 ene 1964 año
1.443
+0.098
7.25%
1 ene 1965 año
1.361
-0.082
-5.69%
1 ene 1966 año
1.669
+0.308
22.65%
1 ene 1967 año
1.715
+0.046
2.73%
1 ene 1968 año
1.539
-0.176
-10.27%
1 ene 1969 año
1.635
+0.096
6.24%
1 ene 1970 año
1.444
-0.191
-11.69%
1 ene 1971 año
1.169
-0.274
-19.01%
1 ene 1972 año
1.01
-0.159
-13.62%
1 ene 1973 año
0.724
-0.286
-28.34%
1 ene 1974 año
0.887
+0.164
22.62%
1 ene 1975 año
0.924
+0.036
4.09%
1 ene 1976 año
1.233
+0.31
33.51%
1 ene 1977 año
0.926
-0.307
-24.91%
1 ene 1978 año
1.042
+0.116
12.53%
1 ene 1979 año
1.086
+0.043
4.16%
1 ene 1980 año
0.906
-0.179
-16.5%
1 ene 1981 año
1.161
+0.254
28.05%
1 ene 1982 año
0.98
-0.181
-15.59%
1 ene 1983 año
0.863
-0.116
-11.87%
1 ene 1984 año
1.025
+0.162
18.78%
1 ene 1985 año
1.089
+0.064
6.23%
1 ene 1986 año
0.913
-0.176
-16.16%
1 ene 1987 año
0.891
-0.022
-2.39%
1 ene 1988 año
0.908
+0.017
1.87%
1 ene 1989 año
1.103
+0.195
21.47%
1 ene 1990 año
0.934
-0.169
-15.34%
1 ene 1991 año
0.881
-0.053
-5.7%
1 ene 1992 año
0.972
+0.091
10.37%
1 ene 1993 año
1.169
+0.197
20.24%
1 ene 1994 año
1.648
+0.479
41.03%
1 ene 1995 año
1.474
-0.175
-10.59%
1 ene 1996 año
1.653
+0.18
12.2%
1 ene 1997 año
1.474
-0.179
-10.82%
1 ene 1998 año
1.586
+0.111
7.55%
1 ene 1999 año
1.102
-0.483
-30.48%
1 ene 2000 año
1.011
-0.092
-8.33%
1 ene 2001 año
1.177
+0.167
16.52%
1 ene 2002 año
1.22
+0.042
3.6%
1 ene 2003 año
1.311
+0.091
7.48%
1 ene 2004 año
1.353
+0.042
3.23%
1 ene 2005 año
1.54
+0.187
13.79%
1 ene 2006 año
1.411
-0.129
-8.36%
1 ene 2007 año
1.535
+0.124
8.76%
1 ene 2008 año
1.607
+0.072
4.72%
1 ene 2009 año
1.564
-0.043
-2.69%
1 ene 2010 año
2.073
+0.509
32.56%
1 ene 2011 año
1.828
-0.245
-11.82%
1 ene 2012 año
1.975
+0.147
8.03%
1 ene 2013 año
2.231
+0.256
12.95%
1 ene 2014 año
2.29
+0.059
2.64%
1 ene 2015 año
2.282
-0.008
-0.35%
Ranking de los países por los datos estadísticos actuales


Comentarios: