29
/es/
es
AIzaSyAYiBZKx7MnpbEhh9jyipgxe19OcubqV5w
April 1, 2024
43635
Latin America & the Caribbean (IDA & IBRD countries)
TLA
false
2
1
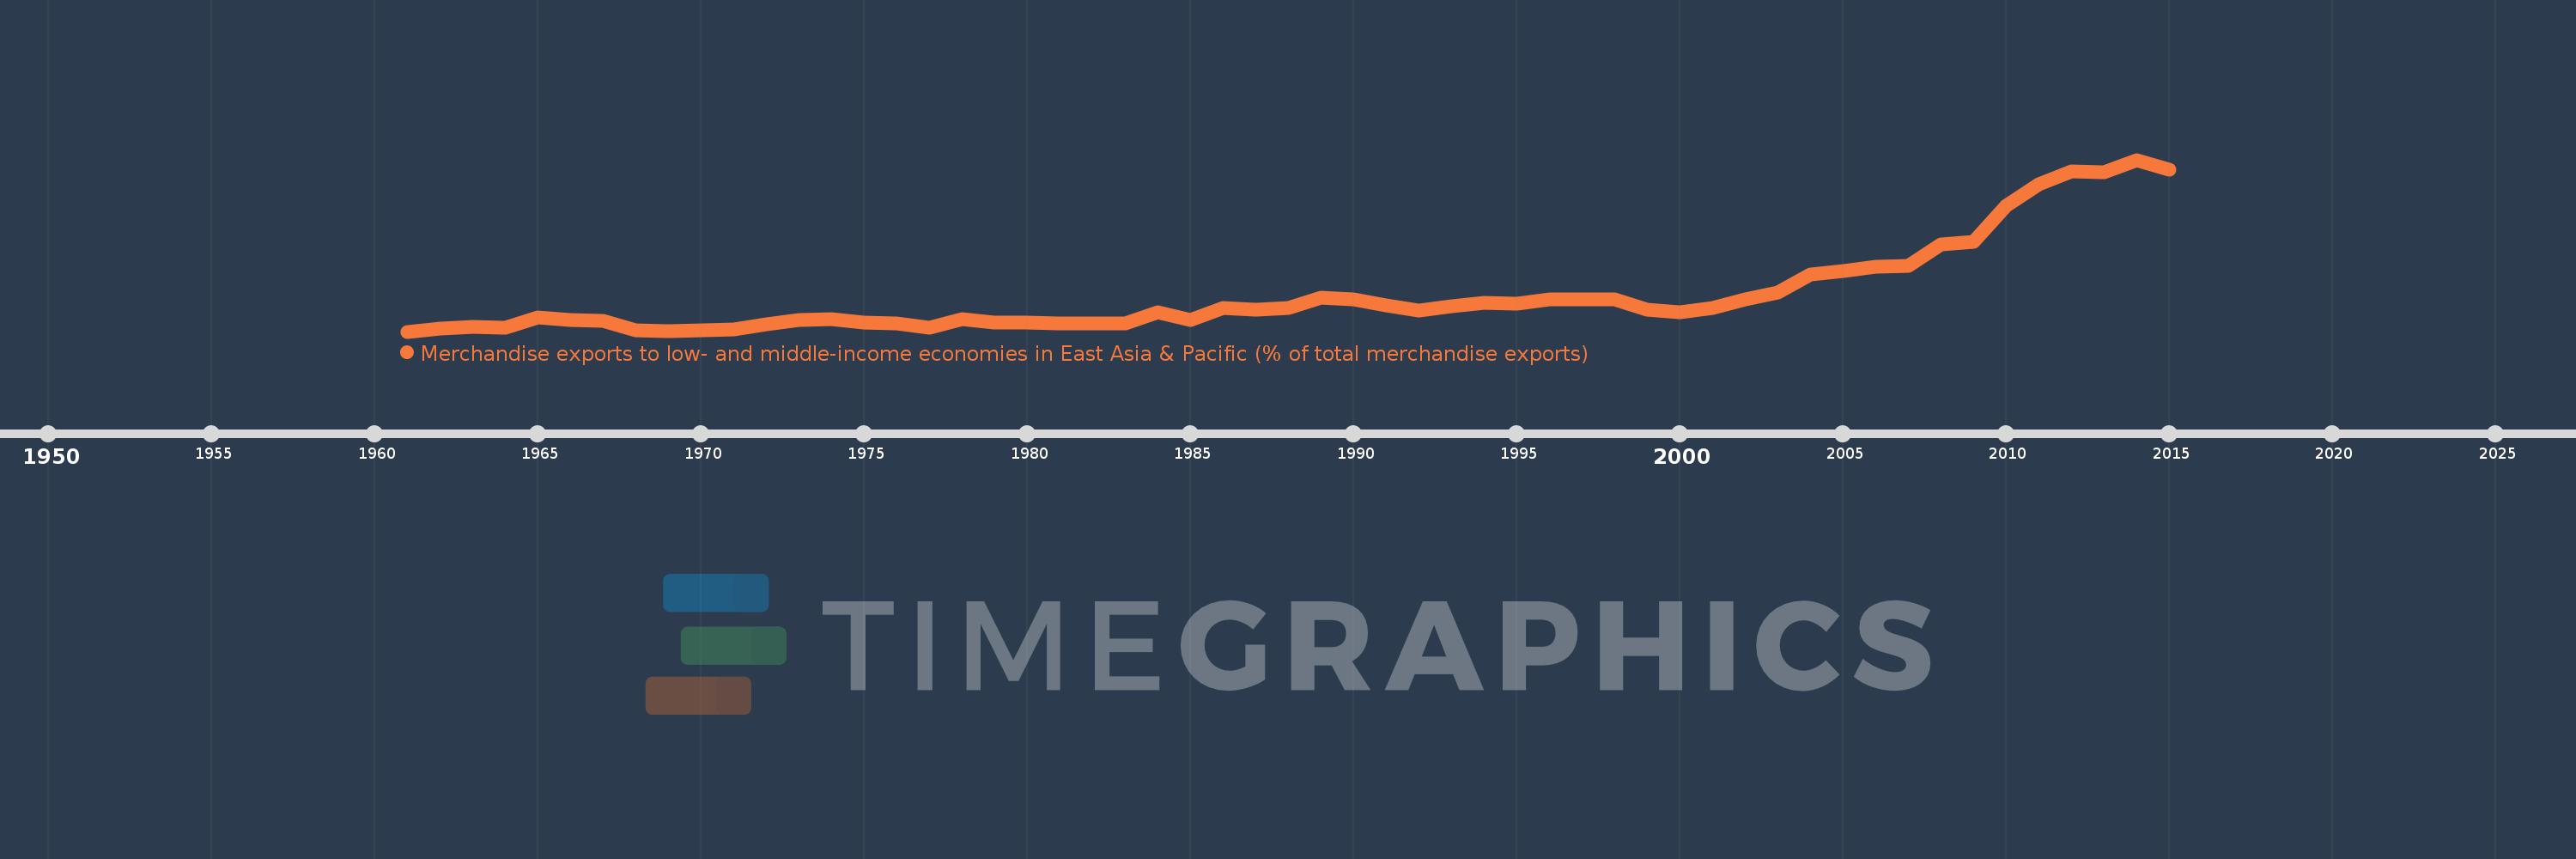
Merchandise exports to low- and middle-income economies in East Asia & Pacific (% of total merchandise exports)
2015,2014,2013,2012,2011,2010,2009,2008,2007,2006,2005,2004,2003,2002,2001,2000,1999,1998,1997,1996,1995,1994,1993,1992,1991,1990,1989,1988,1987,1986,1985,1984,1983,1982,1981,1980,1979,1978,1977,1976,1975,1974,1973,1972,1971,1970,1969,1968,1967,1966,1965,1964,1963,1962,1961
Estas estadísticas en otros países:
AfghanistanAlbaniaAlgeriaArab WorldArgentinaAustraliaAustriaAzerbaijanBahamas, TheBahrainBangladeshBarbadosBelarusBelgiumBermudaBrazilBrunei DarussalamBulgariaCabo VerdeCambodiaCameroonCanadaCaribbean small statesCentral Europe and the BalticsChileChinaColombiaCosta RicaCote d'IvoireCroatiaCubaCyprusCzech RepublicDenmarkDominicaDominican RepublicEarly-demographic dividendEast Asia & PacificEast Asia & Pacific (excluding high income)East Asia & Pacific (IDA & IBRD countries)EcuadorEgypt, Arab Rep.El SalvadorEstoniaEthiopiaEuro areaEurope & Central AsiaEurope & Central Asia (excluding high income)Europe & Central Asia (IDA & IBRD countries)European UnionFijiFinlandFragile and conflict affected situationsFranceGermanyGhanaGreeceGuatemalaGuyanaHeavily indebted poor countries (HIPC)High incomeHondurasHong Kong SAR, ChinaHungaryIBRD onlyIcelandIDA & IBRD totalIDA blendIDA onlyIDA totalIndiaIndonesiaIran, Islamic Rep.IraqIrelandIsraelItalyJamaicaJapanJordanKazakhstanKenyaKorea, Dem. People’s Rep.Korea, Rep.KuwaitLate-demographic dividendLatin America & Caribbean Latin America & Caribbean (excluding high income)Latin America & the Caribbean (IDA & IBRD countries)LatviaLeast developed countries: UN classificationLebanonLithuaniaLow & middle incomeLow incomeLower middle incomeLuxembourgMacao SAR, ChinaMacedonia, FYRMadagascarMalaysiaMaltaMauritiusMexicoMiddle East & North AfricaMiddle East & North Africa (excluding high income)Middle East & North Africa (IDA & IBRD countries)Middle incomeMoldovaMontenegroMoroccoMozambiqueMyanmarNetherlandsNew CaledoniaNew ZealandNigeriaNorth AmericaNorwayOECD membersOmanOther small statesPacific island small statesPakistanPapua New GuineaParaguayPeruPhilippinesPolandPortugalPost-demographic dividendPre-demographic dividendQatarRomaniaRussian FederationSaudi ArabiaSenegalSerbiaSingaporeSlovak RepublicSloveniaSmall statesSolomon IslandsSomaliaSouth AfricaSouth AsiaSouth Asia (IDA & IBRD)SpainSri LankaSt. LuciaSub-Saharan Africa Sub-Saharan Africa (excluding high income)Sub-Saharan Africa (IDA & IBRD countries)SurinameSwedenSwitzerlandSyrian Arab RepublicTanzaniaThailandTogoTongaTrinidad and TobagoTunisiaTurkeyUgandaUkraineUnited Arab EmiratesUnited KingdomUnited StatesUpper middle incomeVenezuela, RBVietnamWorldYemen, Rep.ZambiaZimbabwe línea de tiempo (timeline):
En esta escala de tiempo se presenta un gráfico de 1961 y 2015 de Latin America & the Caribbean (IDA & IBRD countries). Los datos de 1960 están ausentes. El número de observaciones reales por fecha: 55.
Fuente (nombre):
Indicadores del desarrollo mundial
Fuente (organización):
World Bank staff estimates based data from International Monetary Fund's Direction of Trade database.
Categorías:
Private Sector, Trade
Se ha actualizado:
23 abr 2017 año
Los indicadores de los cambios de valor en los últimos años
Mínimo:
0.051
1 ene 1961 año
Máximo:
11.088
1 ene 2014 año
A la fecha de observación
Valor
Cambio absoluto
El cambio con respecto al valor anterior
1 ene 1961 año
0.051
+0.051
0.0%
1 ene 1962 año
0.237
+0.186
361.26%
1 ene 1963 año
0.345
+0.108
45.53%
1 ene 1964 año
0.285
-0.06
-17.39%
1 ene 1965 año
0.948
+0.663
232.18%
1 ene 1966 año
0.802
-0.145
-15.34%
1 ene 1967 año
0.766
-0.036
-4.53%
1 ene 1968 año
0.132
-0.634
-82.82%
1 ene 1969 año
0.092
-0.04
-30.12%
1 ene 1970 año
0.129
+0.037
40.24%
1 ene 1971 año
0.185
+0.056
43.5%
1 ene 1972 año
0.494
+0.309
166.74%
1 ene 1973 año
0.809
+0.315
63.78%
1 ene 1974 año
0.864
+0.055
6.79%
1 ene 1975 año
0.611
-0.253
-29.26%
1 ene 1976 año
0.572
-0.039
-6.33%
1 ene 1977 año
0.282
-0.291
-50.81%
1 ene 1978 año
0.831
+0.549
195.13%
1 ene 1979 año
0.651
-0.18
-21.62%
1 ene 1980 año
0.648
-0.004
-0.55%
1 ene 1981 año
0.591
-0.057
-8.83%
1 ene 1982 año
0.579
-0.011
-1.89%
1 ene 1983 año
0.594
+0.015
2.53%
1 ene 1984 año
1.284
+0.69
116.14%
1 ene 1985 año
0.819
-0.465
-36.24%
1 ene 1986 año
1.548
+0.729
89.02%
1 ene 1987 año
1.466
-0.082
-5.27%
1 ene 1988 año
1.573
+0.108
7.33%
1 ene 1989 año
2.256
+0.682
43.35%
1 ene 1990 año
2.119
-0.137
-6.07%
1 ene 1991 año
1.713
-0.406
-19.15%
1 ene 1992 año
1.412
-0.301
-17.6%
1 ene 1993 año
1.658
+0.247
17.49%
1 ene 1994 año
1.882
+0.223
13.47%
1 ene 1995 año
1.838
-0.044
-2.35%
1 ene 1996 año
2.13
+0.293
15.94%
1 ene 1997 año
2.096
-0.035
-1.64%
1 ene 1998 año
2.109
+0.013
0.62%
1 ene 1999 año
1.474
-0.635
-30.1%
1 ene 2000 año
1.285
-0.189
-12.81%
1 ene 2001 año
1.588
+0.303
23.56%
1 ene 2002 año
2.14
+0.552
34.75%
1 ene 2003 año
2.58
+0.441
20.59%
1 ene 2004 año
3.703
+1.123
43.5%
1 ene 2005 año
3.956
+0.253
6.84%
1 ene 2006 año
4.22
+0.264
6.66%
1 ene 2007 año
4.251
+0.031
0.74%
1 ene 2008 año
5.635
+1.384
32.56%
1 ene 2009 año
5.833
+0.198
3.52%
1 ene 2010 año
8.159
+2.326
39.87%
1 ene 2011 año
9.508
+1.349
16.54%
1 ene 2012 año
10.32
+0.812
8.54%
1 ene 2013 año
10.31
-0.01
-0.1%
1 ene 2014 año
11.088
+0.778
7.54%
1 ene 2015 año
10.468
-0.62
-5.6%
Ranking de los países por los datos estadísticos actuales


Comentarios: