29
/es/
es
AIzaSyAYiBZKx7MnpbEhh9jyipgxe19OcubqV5w
April 1, 2024
30885
Europe & Central Asia
ECS
false
2
1
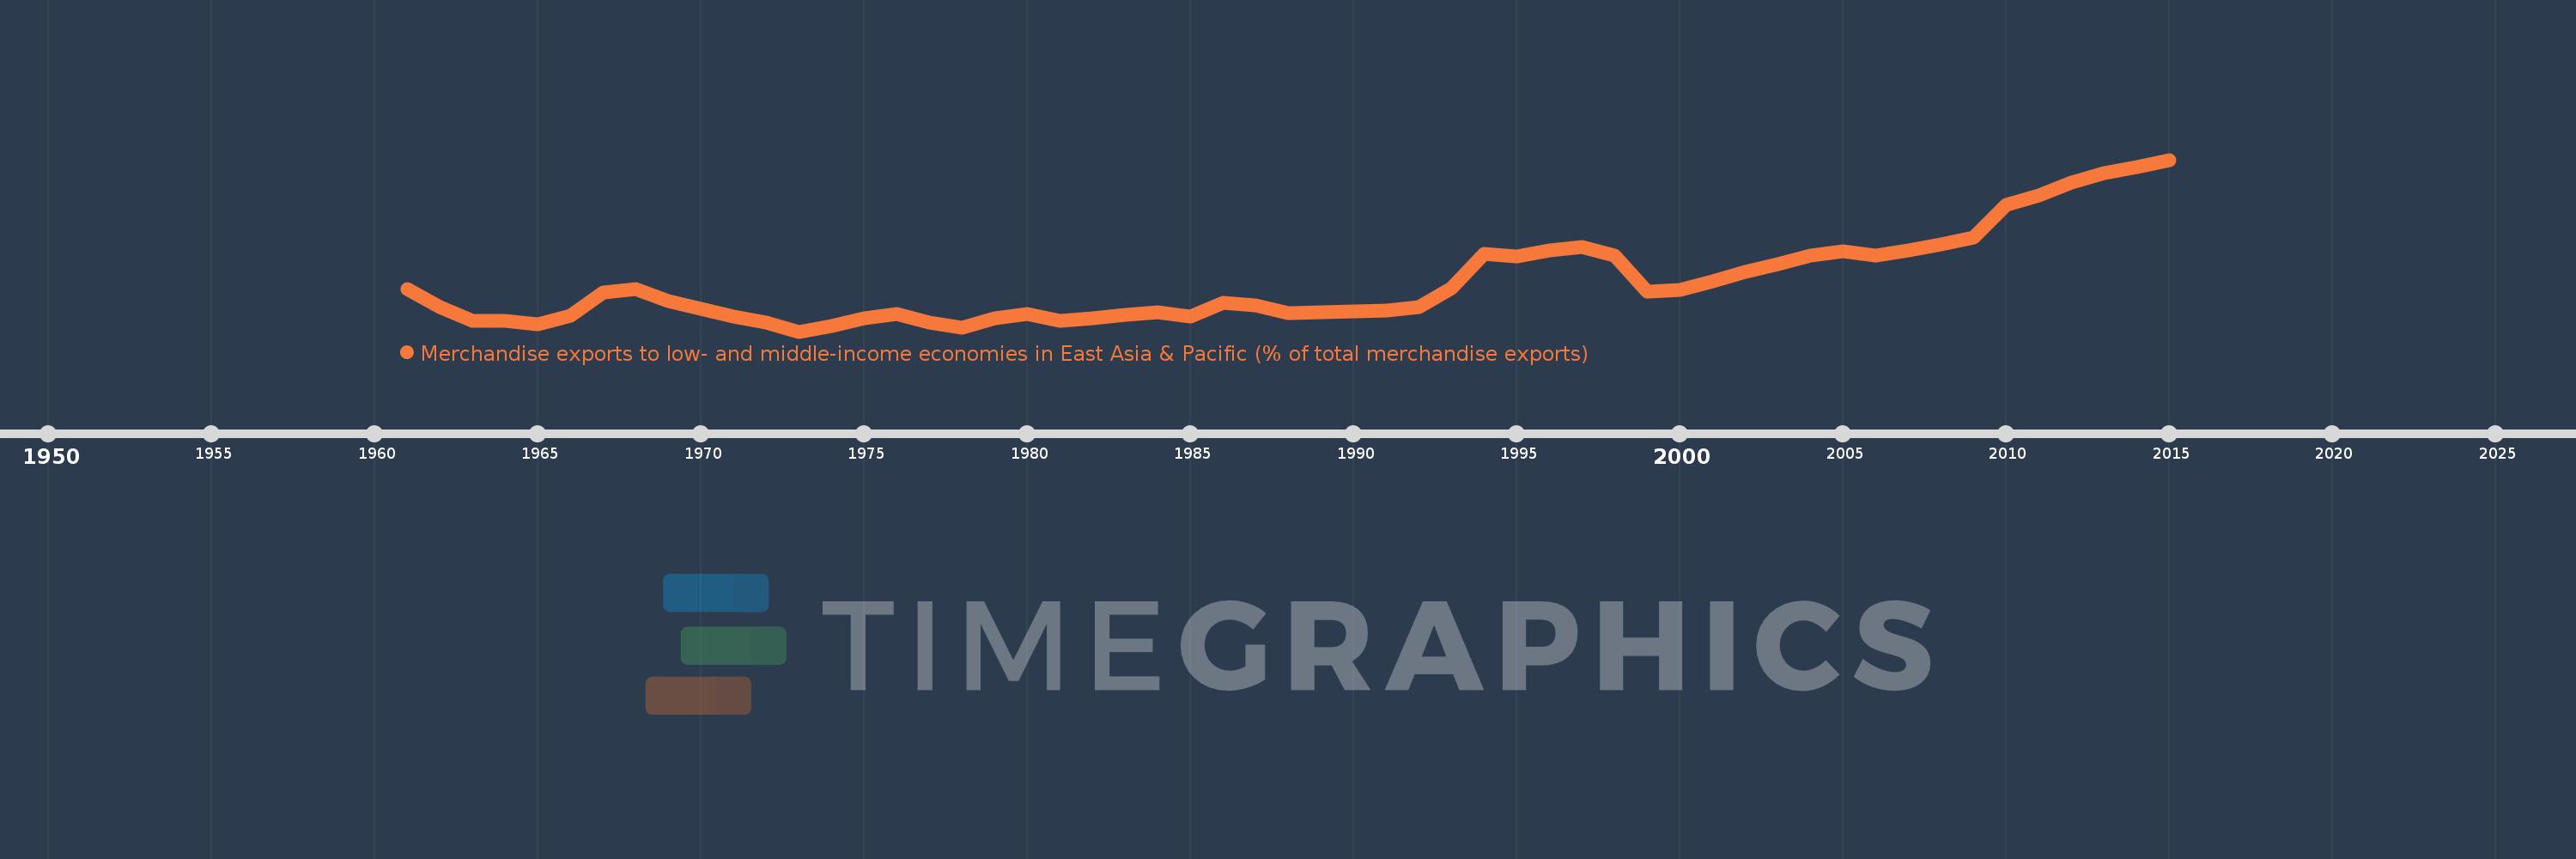
Merchandise exports to low- and middle-income economies in East Asia & Pacific (% of total merchandise exports)
2015,2014,2013,2012,2011,2010,2009,2008,2007,2006,2005,2004,2003,2002,2001,2000,1999,1998,1997,1996,1995,1994,1993,1992,1991,1990,1989,1988,1987,1986,1985,1984,1983,1982,1981,1980,1979,1978,1977,1976,1975,1974,1973,1972,1971,1970,1969,1968,1967,1966,1965,1964,1963,1962,1961
Estas estadísticas en otros países:
AfghanistanAlbaniaAlgeriaArab WorldArgentinaAustraliaAustriaAzerbaijanBahamas, TheBahrainBangladeshBarbadosBelarusBelgiumBermudaBrazilBrunei DarussalamBulgariaCabo VerdeCambodiaCameroonCanadaCaribbean small statesCentral Europe and the BalticsChileChinaColombiaCosta RicaCote d'IvoireCroatiaCubaCyprusCzech RepublicDenmarkDominicaDominican RepublicEarly-demographic dividendEast Asia & PacificEast Asia & Pacific (excluding high income)East Asia & Pacific (IDA & IBRD countries)EcuadorEgypt, Arab Rep.El SalvadorEstoniaEthiopiaEuro areaEurope & Central AsiaEurope & Central Asia (excluding high income)Europe & Central Asia (IDA & IBRD countries)European UnionFijiFinlandFragile and conflict affected situationsFranceGermanyGhanaGreeceGuatemalaGuyanaHeavily indebted poor countries (HIPC)High incomeHondurasHong Kong SAR, ChinaHungaryIBRD onlyIcelandIDA & IBRD totalIDA blendIDA onlyIDA totalIndiaIndonesiaIran, Islamic Rep.IraqIrelandIsraelItalyJamaicaJapanJordanKazakhstanKenyaKorea, Dem. People’s Rep.Korea, Rep.KuwaitLate-demographic dividendLatin America & Caribbean Latin America & Caribbean (excluding high income)Latin America & the Caribbean (IDA & IBRD countries)LatviaLeast developed countries: UN classificationLebanonLithuaniaLow & middle incomeLow incomeLower middle incomeLuxembourgMacao SAR, ChinaMacedonia, FYRMadagascarMalaysiaMaltaMauritiusMexicoMiddle East & North AfricaMiddle East & North Africa (excluding high income)Middle East & North Africa (IDA & IBRD countries)Middle incomeMoldovaMontenegroMoroccoMozambiqueMyanmarNetherlandsNew CaledoniaNew ZealandNigeriaNorth AmericaNorwayOECD membersOmanOther small statesPacific island small statesPakistanPapua New GuineaParaguayPeruPhilippinesPolandPortugalPost-demographic dividendPre-demographic dividendQatarRomaniaRussian FederationSaudi ArabiaSenegalSerbiaSingaporeSlovak RepublicSloveniaSmall statesSolomon IslandsSomaliaSouth AfricaSouth AsiaSouth Asia (IDA & IBRD)SpainSri LankaSt. LuciaSub-Saharan Africa Sub-Saharan Africa (excluding high income)Sub-Saharan Africa (IDA & IBRD countries)SurinameSwedenSwitzerlandSyrian Arab RepublicTanzaniaThailandTogoTongaTrinidad and TobagoTunisiaTurkeyUgandaUkraineUnited Arab EmiratesUnited KingdomUnited StatesUpper middle incomeVenezuela, RBVietnamWorldYemen, Rep.ZambiaZimbabwe línea de tiempo (timeline):
En esta escala de tiempo se presenta un gráfico de 1961 y 2015 de Europe & Central Asia. Los datos de 1960 están ausentes. El número de observaciones reales por fecha: 55.
Fuente (nombre):
Indicadores del desarrollo mundial
Fuente (organización):
World Bank staff estimates based data from International Monetary Fund's Direction of Trade database.
Categorías:
Private Sector, Trade
Se ha actualizado:
23 abr 2017 año
Los indicadores de los cambios de valor en los últimos años
Mínimo:
1.106
1 ene 1973 año
Máximo:
4.587
1 ene 2015 año
A la fecha de observación
Valor
Cambio absoluto
El cambio con respecto al valor anterior
1 ene 1961 año
1.962
+1.962
0.0%
1 ene 1962 año
1.598
-0.363
-18.52%
1 ene 1963 año
1.328
-0.271
-16.95%
1 ene 1964 año
1.328
+0.001
0.06%
1 ene 1965 año
1.262
-0.066
-5.0%
1 ene 1966 año
1.426
+0.164
13.02%
1 ene 1967 año
1.906
+0.48
33.65%
1 ene 1968 año
1.975
+0.069
3.63%
1 ene 1969 año
1.729
-0.246
-12.47%
1 ene 1970 año
1.564
-0.166
-9.57%
1 ene 1971 año
1.402
-0.161
-10.32%
1 ene 1972 año
1.285
-0.117
-8.36%
1 ene 1973 año
1.106
-0.179
-13.93%
1 ene 1974 año
1.22
+0.114
10.32%
1 ene 1975 año
1.382
+0.162
13.28%
1 ene 1976 año
1.468
+0.086
6.24%
1 ene 1977 año
1.287
-0.182
-12.37%
1 ene 1978 año
1.183
-0.104
-8.05%
1 ene 1979 año
1.383
+0.2
16.91%
1 ene 1980 año
1.456
+0.073
5.25%
1 ene 1981 año
1.329
-0.127
-8.7%
1 ene 1982 año
1.375
+0.045
3.41%
1 ene 1983 año
1.441
+0.067
4.87%
1 ene 1984 año
1.497
+0.055
3.82%
1 ene 1985 año
1.419
-0.077
-5.17%
1 ene 1986 año
1.693
+0.273
19.27%
1 ene 1987 año
1.63
-0.063
-3.71%
1 ene 1988 año
1.477
-0.153
-9.4%
1 ene 1989 año
1.504
+0.027
1.83%
1 ene 1990 año
1.509
+0.005
0.35%
1 ene 1991 año
1.535
+0.026
1.7%
1 ene 1992 año
1.596
+0.061
4.0%
1 ene 1993 año
1.991
+0.395
24.76%
1 ene 1994 año
2.677
+0.686
34.48%
1 ene 1995 año
2.627
-0.051
-1.9%
1 ene 1996 año
2.758
+0.131
4.99%
1 ene 1997 año
2.826
+0.068
2.48%
1 ene 1998 año
2.64
-0.185
-6.56%
1 ene 1999 año
1.921
-0.72
-27.26%
1 ene 2000 año
1.944
+0.024
1.24%
1 ene 2001 año
2.119
+0.175
8.99%
1 ene 2002 año
2.318
+0.199
9.38%
1 ene 2003 año
2.479
+0.16
6.92%
1 ene 2004 año
2.649
+0.17
6.86%
1 ene 2005 año
2.726
+0.078
2.94%
1 ene 2006 año
2.646
-0.08
-2.94%
1 ene 2007 año
2.743
+0.097
3.67%
1 ene 2008 año
2.864
+0.12
4.39%
1 ene 2009 año
3.012
+0.149
5.19%
1 ene 2010 año
3.668
+0.656
21.77%
1 ene 2011 año
3.872
+0.203
5.54%
1 ene 2012 año
4.133
+0.261
6.75%
1 ene 2013 año
4.321
+0.188
4.54%
1 ene 2014 año
4.444
+0.123
2.86%
1 ene 2015 año
4.587
+0.142
3.2%
Ranking de los países por los datos estadísticos actuales


Comentarios: