29
/es/
es
AIzaSyAYiBZKx7MnpbEhh9jyipgxe19OcubqV5w
April 1, 2024
216710
Pakistan
PAK
true
2
1
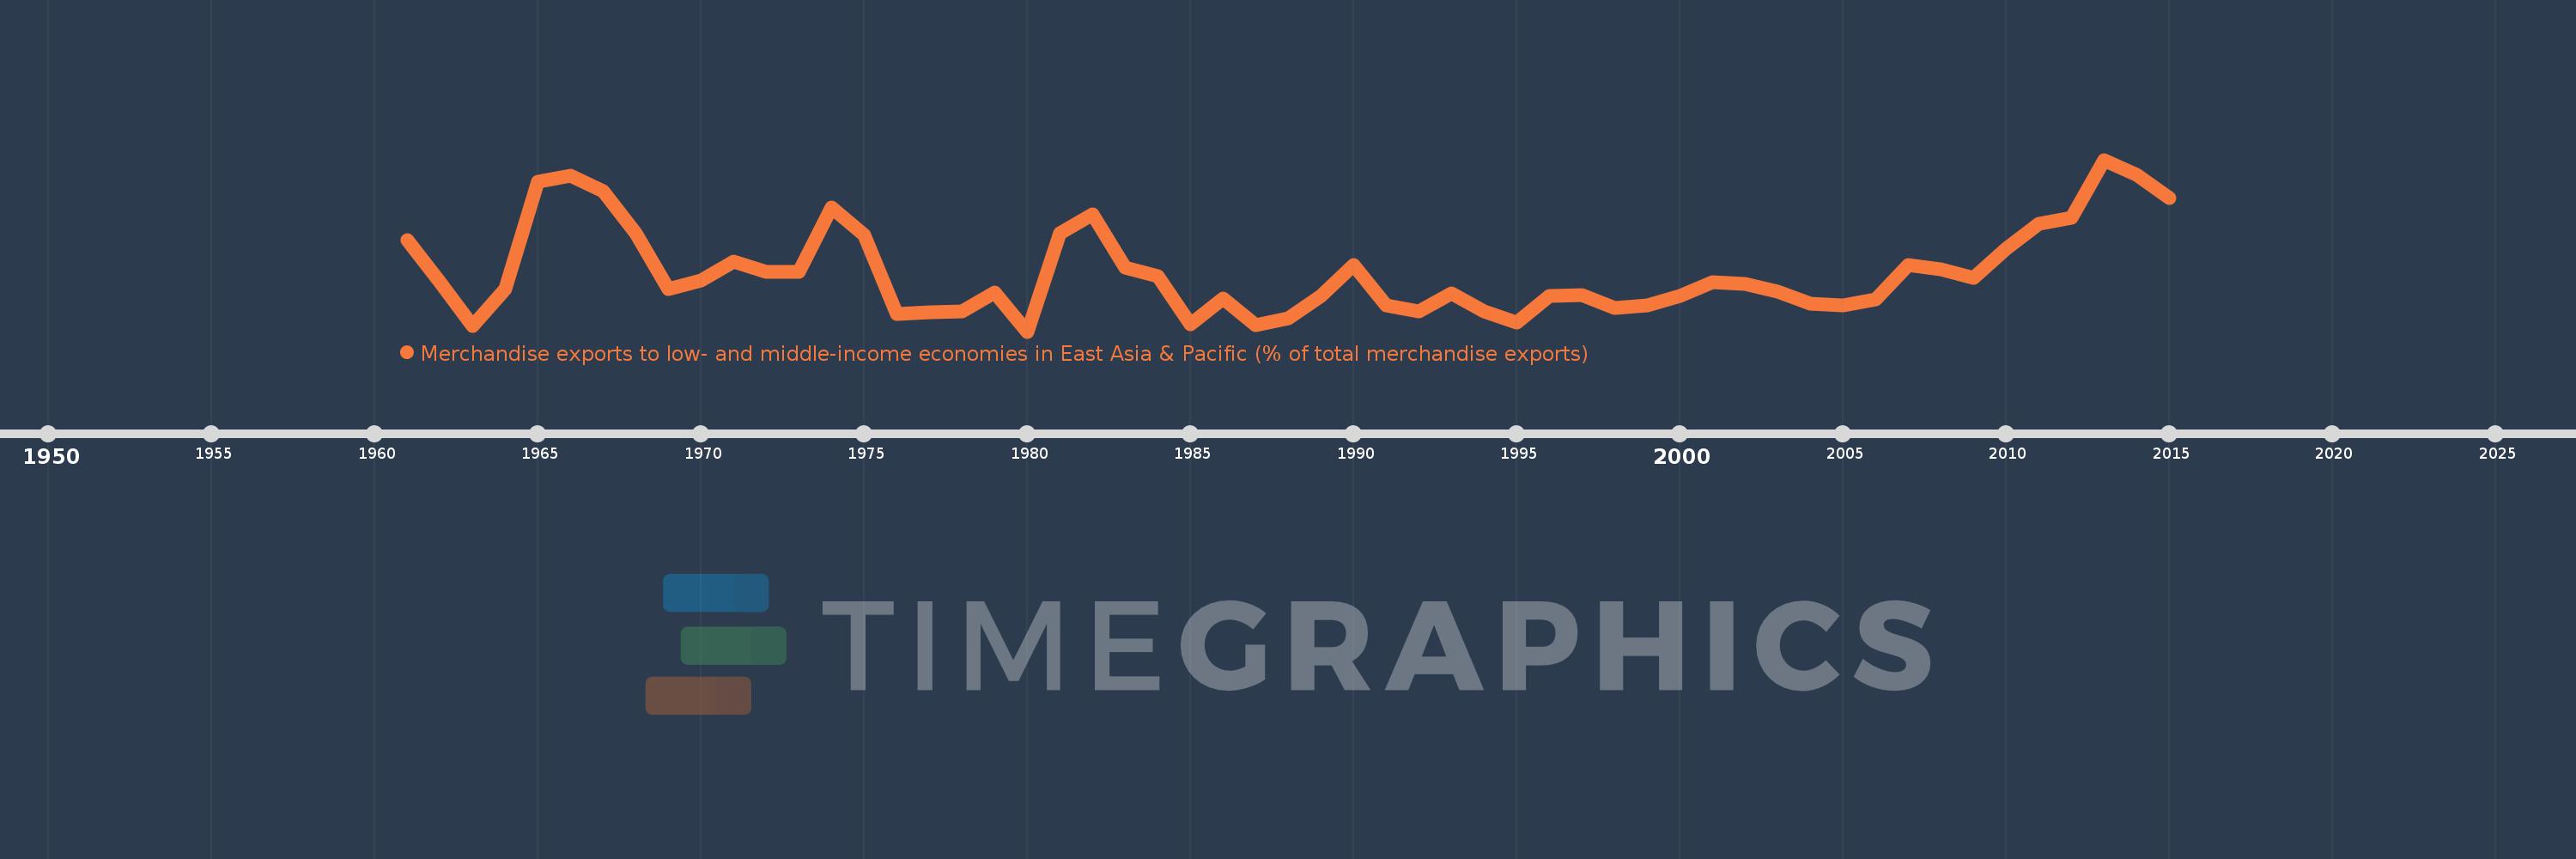
Merchandise exports to low- and middle-income economies in East Asia & Pacific (% of total merchandise exports)
2015,2014,2013,2012,2011,2010,2009,2008,2007,2006,2005,2004,2003,2002,2001,2000,1999,1998,1997,1996,1995,1994,1993,1992,1991,1990,1989,1988,1987,1986,1985,1984,1983,1982,1981,1980,1979,1978,1977,1976,1975,1974,1973,1972,1971,1970,1969,1968,1967,1966,1965,1964,1963,1962,1961
Estas estadísticas en otros países:
AfghanistanAlbaniaAlgeriaArab WorldArgentinaAustraliaAustriaAzerbaijanBahamas, TheBahrainBangladeshBarbadosBelarusBelgiumBermudaBrazilBrunei DarussalamBulgariaCabo VerdeCambodiaCameroonCanadaCaribbean small statesCentral Europe and the BalticsChileChinaColombiaCosta RicaCote d'IvoireCroatiaCubaCyprusCzech RepublicDenmarkDominicaDominican RepublicEarly-demographic dividendEast Asia & PacificEast Asia & Pacific (excluding high income)East Asia & Pacific (IDA & IBRD countries)EcuadorEgypt, Arab Rep.El SalvadorEstoniaEthiopiaEuro areaEurope & Central AsiaEurope & Central Asia (excluding high income)Europe & Central Asia (IDA & IBRD countries)European UnionFijiFinlandFragile and conflict affected situationsFranceGermanyGhanaGreeceGuatemalaGuyanaHeavily indebted poor countries (HIPC)High incomeHondurasHong Kong SAR, ChinaHungaryIBRD onlyIcelandIDA & IBRD totalIDA blendIDA onlyIDA totalIndiaIndonesiaIran, Islamic Rep.IraqIrelandIsraelItalyJamaicaJapanJordanKazakhstanKenyaKorea, Dem. People’s Rep.Korea, Rep.KuwaitLate-demographic dividendLatin America & Caribbean Latin America & Caribbean (excluding high income)Latin America & the Caribbean (IDA & IBRD countries)LatviaLeast developed countries: UN classificationLebanonLithuaniaLow & middle incomeLow incomeLower middle incomeLuxembourgMacao SAR, ChinaMacedonia, FYRMadagascarMalaysiaMaltaMauritiusMexicoMiddle East & North AfricaMiddle East & North Africa (excluding high income)Middle East & North Africa (IDA & IBRD countries)Middle incomeMoldovaMontenegroMoroccoMozambiqueMyanmarNetherlandsNew CaledoniaNew ZealandNigeriaNorth AmericaNorwayOECD membersOmanOther small statesPacific island small statesPakistanPapua New GuineaParaguayPeruPhilippinesPolandPortugalPost-demographic dividendPre-demographic dividendQatarRomaniaRussian FederationSaudi ArabiaSenegalSerbiaSingaporeSlovak RepublicSloveniaSmall statesSolomon IslandsSomaliaSouth AfricaSouth AsiaSouth Asia (IDA & IBRD)SpainSri LankaSt. LuciaSub-Saharan Africa Sub-Saharan Africa (excluding high income)Sub-Saharan Africa (IDA & IBRD countries)SurinameSwedenSwitzerlandSyrian Arab RepublicTanzaniaThailandTogoTongaTrinidad and TobagoTunisiaTurkeyUgandaUkraineUnited Arab EmiratesUnited KingdomUnited StatesUpper middle incomeVenezuela, RBVietnamWorldYemen, Rep.ZambiaZimbabwe línea de tiempo (timeline):
En esta escala de tiempo se presenta un gráfico de 1961 y 2015 de Pakistan. Los datos de 1960 están ausentes. El número de observaciones reales por fecha: 55.
Fuente (nombre):
Indicadores del desarrollo mundial
Fuente (organización):
World Bank staff estimates based data from International Monetary Fund's Direction of Trade database.
Categorías:
Private Sector, Trade
Se ha actualizado:
23 abr 2017 año
Los indicadores de los cambios de valor en los últimos años
Mínimo:
2.404
1 ene 1980 año
Máximo:
14.786
1 ene 2013 año
A la fecha de observación
Valor
Cambio absoluto
El cambio con respecto al valor anterior
1 ene 1961 año
9.01
+9.01
0.0%
1 ene 1962 año
5.941
-3.069
-34.06%
1 ene 1963 año
2.796
-3.145
-52.94%
1 ene 1964 año
5.484
+2.689
96.17%
1 ene 1965 año
13.234
+7.75
141.31%
1 ene 1966 año
13.615
+0.381
2.88%
1 ene 1967 año
12.517
-1.098
-8.06%
1 ene 1968 año
9.513
-3.004
-24.0%
1 ene 1969 año
5.456
-4.057
-42.65%
1 ene 1970 año
6.088
+0.632
11.59%
1 ene 1971 año
7.423
+1.335
21.93%
1 ene 1972 año
6.694
-0.729
-9.82%
1 ene 1973 año
6.682
-0.013
-0.19%
1 ene 1974 año
11.352
+4.671
69.9%
1 ene 1975 año
9.355
-1.998
-17.6%
1 ene 1976 año
3.682
-5.673
-60.64%
1 ene 1977 año
3.808
+0.126
3.42%
1 ene 1978 año
3.845
+0.038
1.0%
1 ene 1979 año
5.251
+1.405
36.54%
1 ene 1980 año
2.404
-2.846
-54.21%
1 ene 1981 año
9.468
+7.063
293.76%
1 ene 1982 año
10.832
+1.365
14.41%
1 ene 1983 año
7.011
-3.821
-35.27%
1 ene 1984 año
6.382
-0.629
-8.98%
1 ene 1985 año
2.901
-3.481
-54.55%
1 ene 1986 año
4.807
+1.906
65.73%
1 ene 1987 año
2.863
-1.944
-40.44%
1 ene 1988 año
3.371
+0.508
17.73%
1 ene 1989 año
4.983
+1.612
47.82%
1 ene 1990 año
7.212
+2.23
44.75%
1 ene 1991 año
4.301
-2.911
-40.37%
1 ene 1992 año
3.883
-0.417
-9.7%
1 ene 1993 año
5.176
+1.293
33.29%
1 ene 1994 año
3.846
-1.33
-25.7%
1 ene 1995 año
3.036
-0.81
-21.07%
1 ene 1996 año
4.995
+1.959
64.55%
1 ene 1997 año
5.018
+0.023
0.46%
1 ene 1998 año
4.1
-0.918
-18.29%
1 ene 1999 año
4.313
+0.213
5.2%
1 ene 2000 año
4.97
+0.657
15.23%
1 ene 2001 año
5.955
+0.985
19.81%
1 ene 2002 año
5.86
-0.095
-1.6%
1 ene 2003 año
5.291
-0.569
-9.7%
1 ene 2004 año
4.434
-0.857
-16.2%
1 ene 2005 año
4.268
-0.166
-3.74%
1 ene 2006 año
4.715
+0.447
10.48%
1 ene 2007 año
7.187
+2.471
52.41%
1 ene 2008 año
6.908
-0.278
-3.87%
1 ene 2009 año
6.27
-0.638
-9.24%
1 ene 2010 año
8.374
+2.104
33.55%
1 ene 2011 año
10.169
+1.795
21.44%
1 ene 2012 año
10.614
+0.445
4.37%
1 ene 2013 año
14.786
+4.171
39.3%
1 ene 2014 año
13.69
-1.096
-7.41%
1 ene 2015 año
12.053
-1.636
-11.95%
Ranking de los países por los datos estadísticos actuales


Comentarios: