29
/es/
es
AIzaSyAYiBZKx7MnpbEhh9jyipgxe19OcubqV5w
April 1, 2024
50903
Middle income
MIC
false
2
1
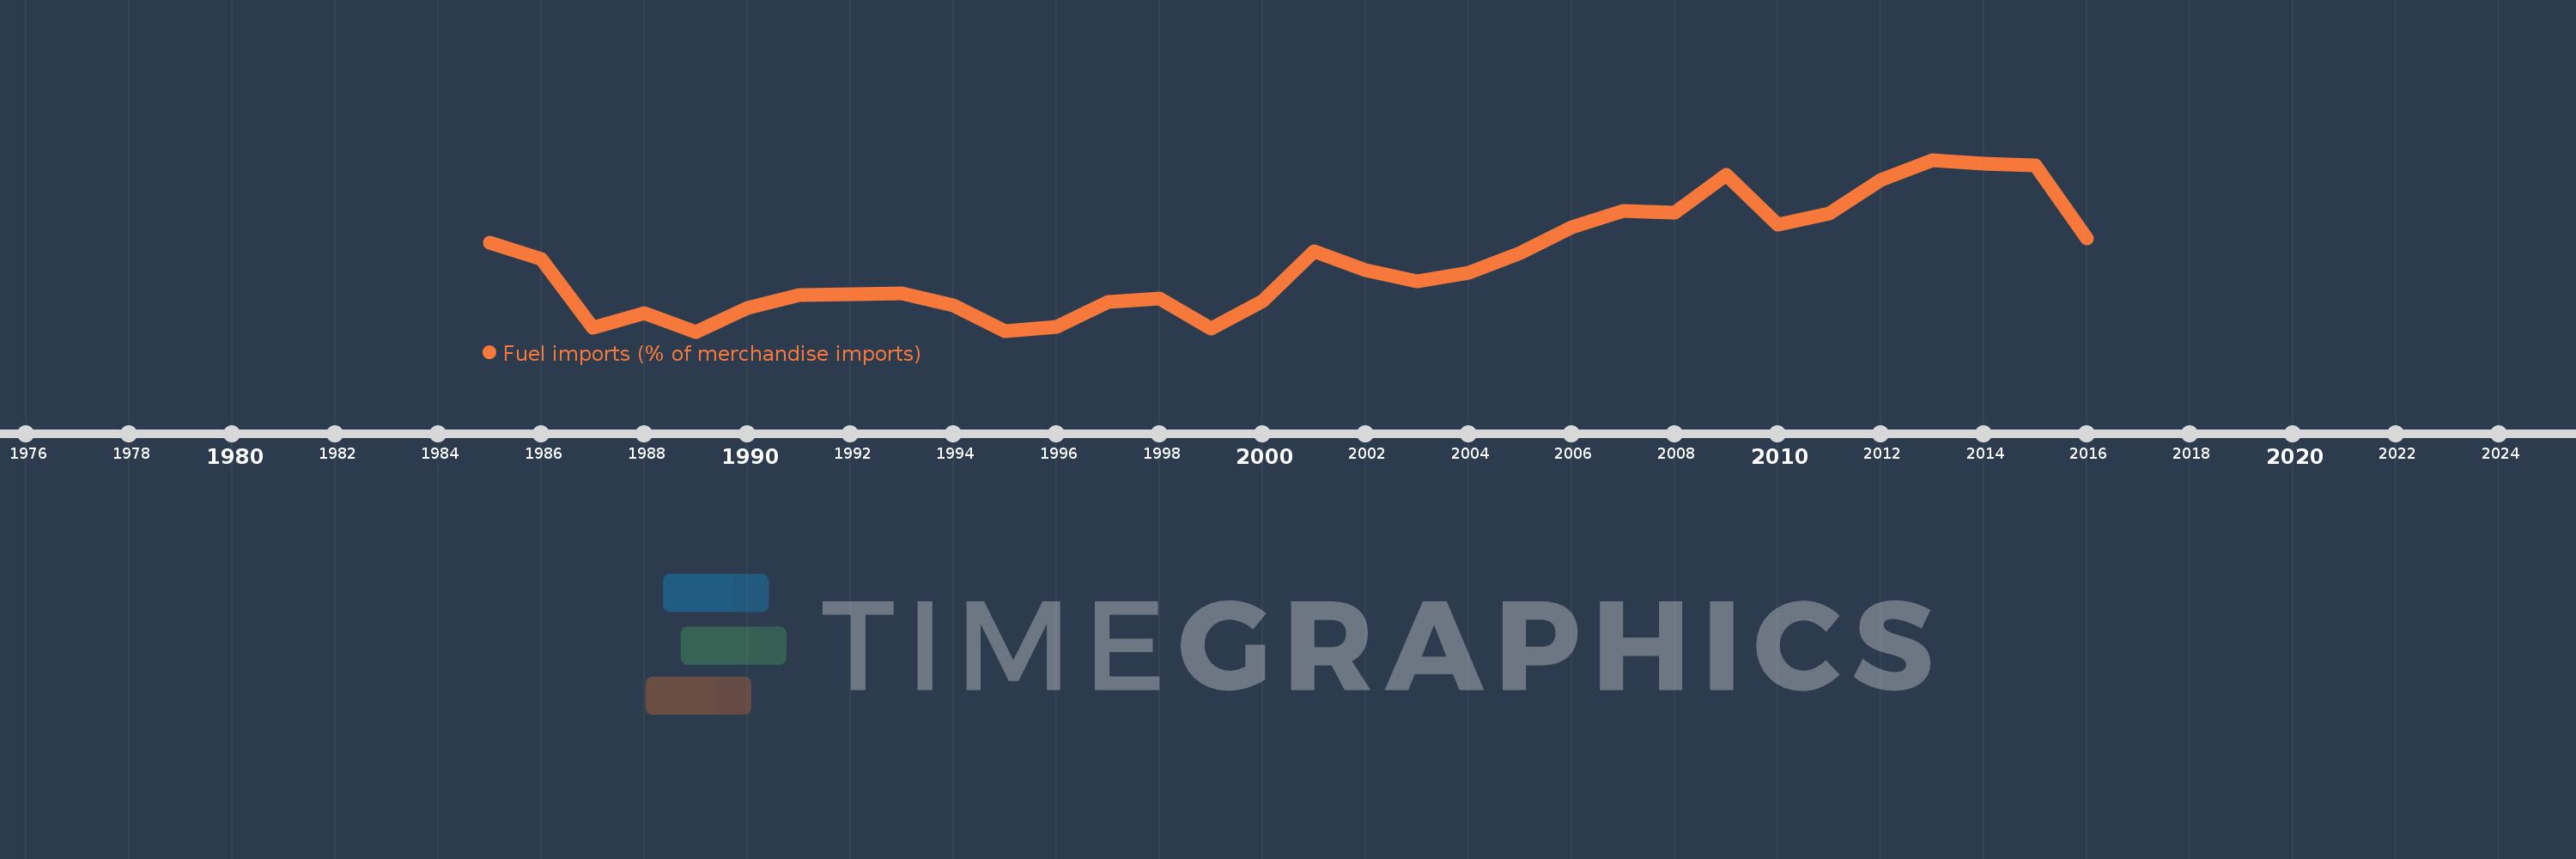
Fuel imports (% of merchandise imports)
2016,2015,2014,2013,2012,2011,2010,2009,2008,2007,2006,2005,2004,2003,2002,2001,2000,1999,1998,1997,1996,1995,1994,1993,1992,1991,1990,1989,1988,1987,1986,1985
Estas estadísticas en otros países:
AfghanistanAlbaniaAlgeriaAndorraAngolaAntigua and BarbudaArab WorldArgentinaArmeniaArubaAustraliaAustriaAzerbaijanBahamas, TheBahrainBangladeshBarbadosBelarusBelgiumBelizeBeninBermudaBhutanBoliviaBosnia and HerzegovinaBotswanaBrazilBrunei DarussalamBulgariaBurkina FasoBurundiCabo VerdeCambodiaCameroonCanadaCaribbean small statesCayman IslandsCentral African RepublicCentral Europe and the BalticsChadChileChinaColombiaComorosCongo, Dem. Rep.Congo, Rep.Costa RicaCote d'IvoireCroatiaCubaCyprusCzech RepublicDenmarkDjiboutiDominicaDominican RepublicEarly-demographic dividendEast Asia & PacificEast Asia & Pacific (excluding high income)East Asia & Pacific (IDA & IBRD countries)EcuadorEgypt, Arab Rep.El SalvadorEquatorial GuineaEritreaEstoniaEthiopiaEuro areaEurope & Central AsiaEurope & Central Asia (excluding high income)Europe & Central Asia (IDA & IBRD countries)European UnionFaroe IslandsFijiFinlandFragile and conflict affected situationsFranceFrench PolynesiaGabonGambia, TheGeorgiaGermanyGhanaGreeceGreenlandGrenadaGuatemalaGuineaGuinea-BissauGuyanaHaitiHeavily indebted poor countries (HIPC)High incomeHondurasHong Kong SAR, ChinaHungaryIBRD onlyIcelandIDA & IBRD totalIDA blendIDA onlyIDA totalIndiaIndonesiaIran, Islamic Rep.IraqIrelandIsraelItalyJamaicaJapanJordanKazakhstanKenyaKiribatiKorea, Rep.KuwaitKyrgyz RepublicLao PDRLate-demographic dividendLatin America & Caribbean Latin America & Caribbean (excluding high income)Latin America & the Caribbean (IDA & IBRD countries)LatviaLeast developed countries: UN classificationLebanonLesothoLiberiaLibyaLithuaniaLow & middle incomeLow incomeLower middle incomeLuxembourgMacao SAR, ChinaMacedonia, FYRMadagascarMalawiMalaysiaMaldivesMaliMaltaMauritaniaMauritiusMexicoMiddle East & North AfricaMiddle East & North Africa (excluding high income)Middle East & North Africa (IDA & IBRD countries)Middle incomeMoldovaMongoliaMoroccoMozambiqueMyanmarNamibiaNepalNetherlandsNew CaledoniaNew ZealandNicaraguaNigerNigeriaNorth AmericaNorwayOECD membersOmanOther small statesPacific island small statesPakistanPalauPanamaPapua New GuineaParaguayPeruPhilippinesPolandPortugalPost-demographic dividendPre-demographic dividendQatarRomaniaRussian FederationRwandaSamoaSao Tome and PrincipeSaudi ArabiaSenegalSerbiaSeychellesSierra LeoneSingaporeSlovak RepublicSloveniaSmall statesSolomon IslandsSomaliaSouth AfricaSouth AsiaSouth Asia (IDA & IBRD)SpainSri LankaSt. Kitts and NevisSt. LuciaSt. Vincent and the GrenadinesSub-Saharan Africa Sub-Saharan Africa (excluding high income)Sub-Saharan Africa (IDA & IBRD countries)SudanSurinameSwazilandSwedenSwitzerlandSyrian Arab RepublicTajikistanTanzaniaThailandTimor-LesteTogoTongaTrinidad and TobagoTunisiaTurkeyTurkmenistanTurks and Caicos IslandsTuvaluUgandaUkraineUnited Arab EmiratesUnited KingdomUnited StatesUpper middle incomeUruguayVanuatuVenezuela, RBVietnamVirgin Islands (U.S.)WorldYemen, Rep.ZambiaZimbabwe línea de tiempo (timeline):
En esta escala de tiempo se presenta un gráfico de 1985 y 2016 de Middle income. Los datos de 1984 están ausentes. El número de observaciones reales por fecha: 32.
Fuente (nombre):
Indicadores del desarrollo mundial
Fuente (organización):
World Bank staff estimates from the Comtrade database maintained by the United Nations Statistics Division.
Categorías:
Energy & Mining, Private Sector, Trade
Se ha actualizado:
23 abr 2017 año
Los indicadores de los cambios de valor en los últimos años
Mínimo:
7.658
1 ene 1989 año
Máximo:
18.199
1 ene 2013 año
A la fecha de observación
Valor
Cambio absoluto
El cambio con respecto al valor anterior
1 ene 1985 año
13.119
+13.119
0.0%
1 ene 1986 año
12.098
-1.021
-7.79%
1 ene 1987 año
7.874
-4.224
-34.92%
1 ene 1988 año
8.772
+0.898
11.41%
1 ene 1989 año
7.658
-1.114
-12.7%
1 ene 1990 año
9.114
+1.456
19.02%
1 ene 1991 año
9.912
+0.798
8.76%
1 ene 1992 año
9.937
+0.025
0.25%
1 ene 1993 año
9.992
+0.055
0.55%
1 ene 1994 año
9.251
-0.741
-7.42%
1 ene 1995 año
7.694
-1.557
-16.83%
1 ene 1996 año
7.959
+0.265
3.44%
1 ene 1997 año
9.5
+1.541
19.36%
1 ene 1998 año
9.7
+0.199
2.1%
1 ene 1999 año
7.818
-1.882
-19.4%
1 ene 2000 año
9.515
+1.697
21.71%
1 ene 2001 año
12.572
+3.057
32.13%
1 ene 2002 año
11.403
-1.169
-9.3%
1 ene 2003 año
10.749
-0.654
-5.74%
1 ene 2004 año
11.261
+0.512
4.77%
1 ene 2005 año
12.473
+1.212
10.77%
1 ene 2006 año
14.044
+1.571
12.59%
1 ene 2007 año
15.065
+1.021
7.27%
1 ene 2008 año
14.971
-0.094
-0.62%
1 ene 2009 año
17.251
+2.28
15.23%
1 ene 2010 año
14.232
-3.019
-17.5%
1 ene 2011 año
14.914
+0.682
4.79%
1 ene 2012 año
16.946
+2.032
13.62%
1 ene 2013 año
18.199
+1.253
7.39%
1 ene 2014 año
17.946
-0.253
-1.39%
1 ene 2015 año
17.869
-0.077
-0.43%
1 ene 2016 año
13.398
-4.471
-25.02%
Ranking de los países por los datos estadísticos actuales


Comentarios: