29
/es/
es
AIzaSyAYiBZKx7MnpbEhh9jyipgxe19OcubqV5w
April 1, 2024
42377
Latin America & Caribbean (excluding high income)
LAC
false
2
1
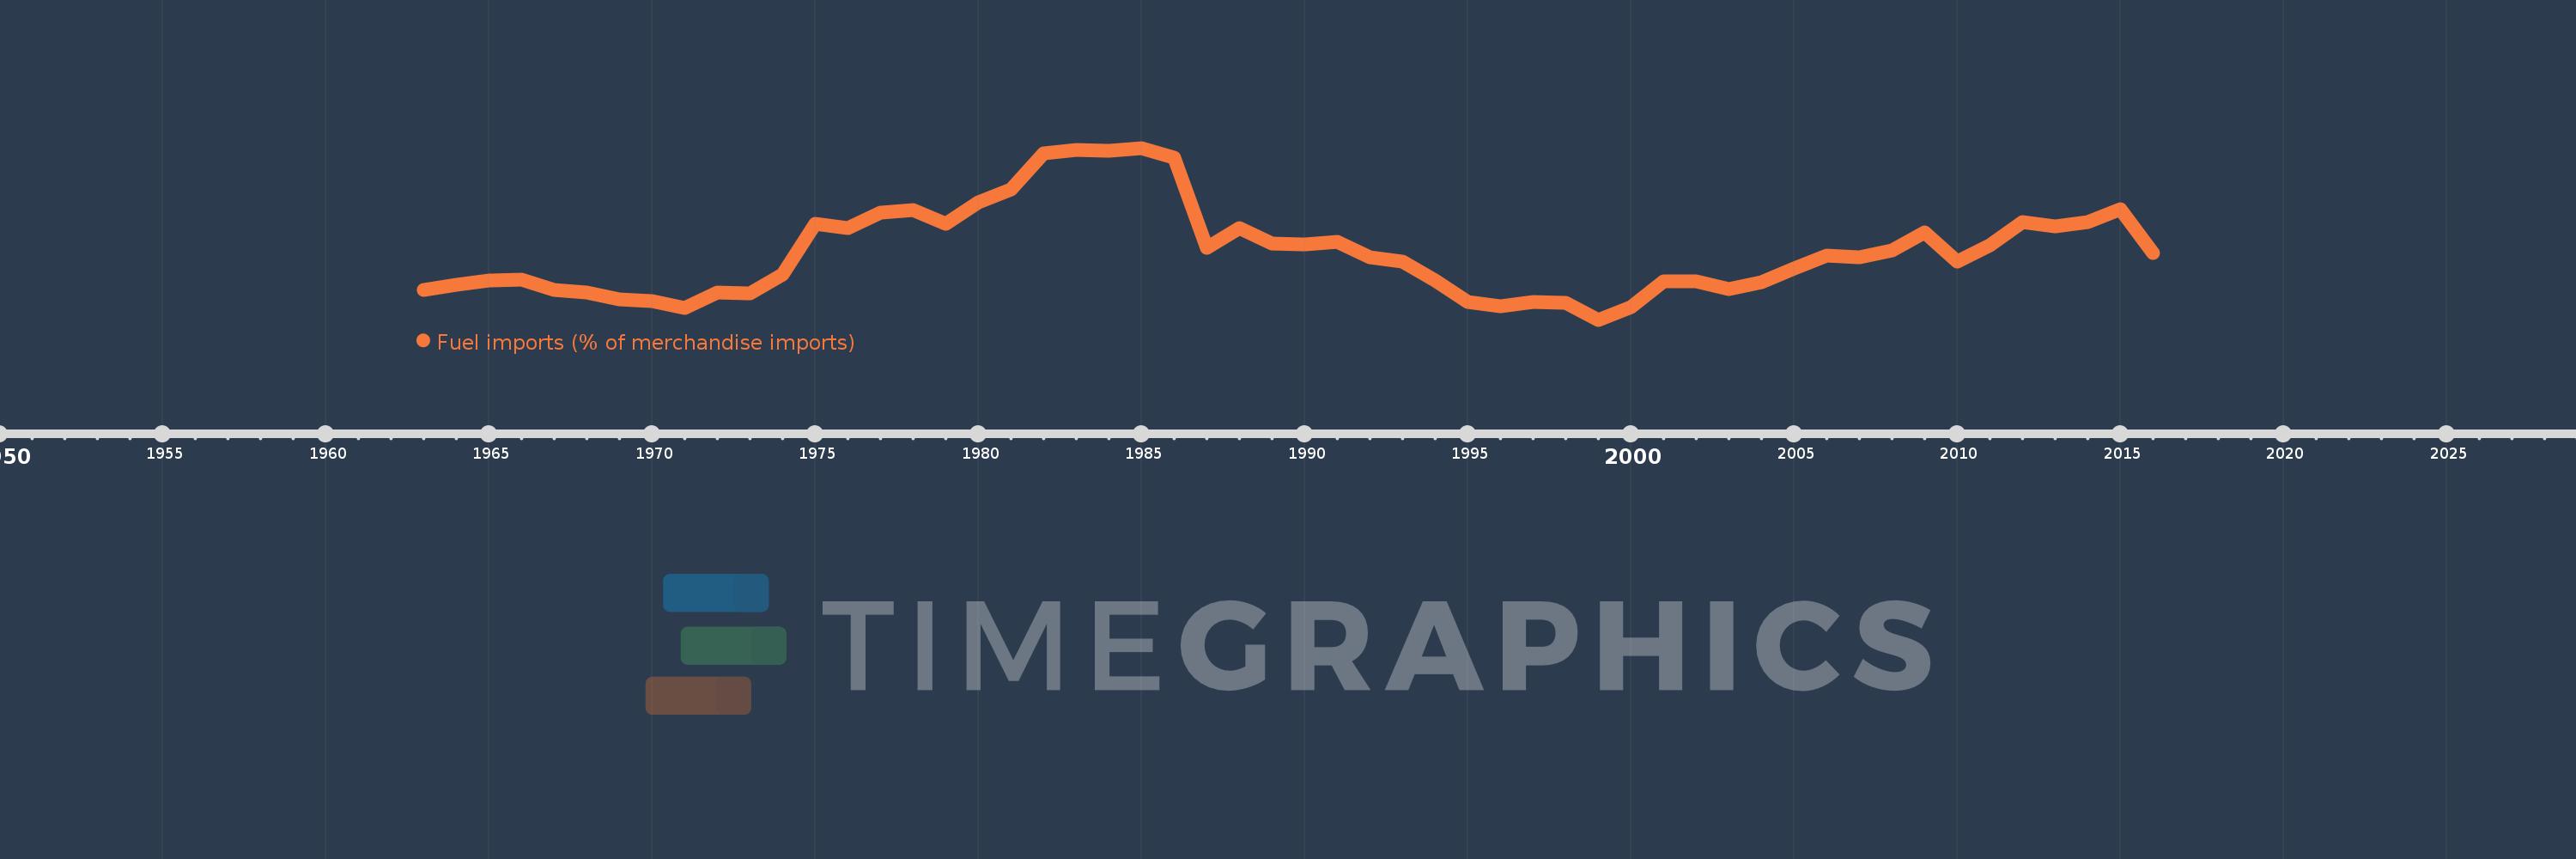
Fuel imports (% of merchandise imports)
2016,2015,2014,2013,2012,2011,2010,2009,2008,2007,2006,2005,2004,2003,2002,2001,2000,1999,1998,1997,1996,1995,1994,1993,1992,1991,1990,1989,1988,1987,1986,1985,1984,1983,1982,1981,1980,1979,1978,1977,1976,1975,1974,1973,1972,1971,1970,1969,1968,1967,1966,1965,1964,1963
Estas estadísticas en otros países:
AfghanistanAlbaniaAlgeriaAndorraAngolaAntigua and BarbudaArab WorldArgentinaArmeniaArubaAustraliaAustriaAzerbaijanBahamas, TheBahrainBangladeshBarbadosBelarusBelgiumBelizeBeninBermudaBhutanBoliviaBosnia and HerzegovinaBotswanaBrazilBrunei DarussalamBulgariaBurkina FasoBurundiCabo VerdeCambodiaCameroonCanadaCaribbean small statesCayman IslandsCentral African RepublicCentral Europe and the BalticsChadChileChinaColombiaComorosCongo, Dem. Rep.Congo, Rep.Costa RicaCote d'IvoireCroatiaCubaCyprusCzech RepublicDenmarkDjiboutiDominicaDominican RepublicEarly-demographic dividendEast Asia & PacificEast Asia & Pacific (excluding high income)East Asia & Pacific (IDA & IBRD countries)EcuadorEgypt, Arab Rep.El SalvadorEquatorial GuineaEritreaEstoniaEthiopiaEuro areaEurope & Central AsiaEurope & Central Asia (excluding high income)Europe & Central Asia (IDA & IBRD countries)European UnionFaroe IslandsFijiFinlandFragile and conflict affected situationsFranceFrench PolynesiaGabonGambia, TheGeorgiaGermanyGhanaGreeceGreenlandGrenadaGuatemalaGuineaGuinea-BissauGuyanaHaitiHeavily indebted poor countries (HIPC)High incomeHondurasHong Kong SAR, ChinaHungaryIBRD onlyIcelandIDA & IBRD totalIDA blendIDA onlyIDA totalIndiaIndonesiaIran, Islamic Rep.IraqIrelandIsraelItalyJamaicaJapanJordanKazakhstanKenyaKiribatiKorea, Rep.KuwaitKyrgyz RepublicLao PDRLate-demographic dividendLatin America & Caribbean Latin America & Caribbean (excluding high income)Latin America & the Caribbean (IDA & IBRD countries)LatviaLeast developed countries: UN classificationLebanonLesothoLiberiaLibyaLithuaniaLow & middle incomeLow incomeLower middle incomeLuxembourgMacao SAR, ChinaMacedonia, FYRMadagascarMalawiMalaysiaMaldivesMaliMaltaMauritaniaMauritiusMexicoMiddle East & North AfricaMiddle East & North Africa (excluding high income)Middle East & North Africa (IDA & IBRD countries)Middle incomeMoldovaMongoliaMoroccoMozambiqueMyanmarNamibiaNepalNetherlandsNew CaledoniaNew ZealandNicaraguaNigerNigeriaNorth AmericaNorwayOECD membersOmanOther small statesPacific island small statesPakistanPalauPanamaPapua New GuineaParaguayPeruPhilippinesPolandPortugalPost-demographic dividendPre-demographic dividendQatarRomaniaRussian FederationRwandaSamoaSao Tome and PrincipeSaudi ArabiaSenegalSerbiaSeychellesSierra LeoneSingaporeSlovak RepublicSloveniaSmall statesSolomon IslandsSomaliaSouth AfricaSouth AsiaSouth Asia (IDA & IBRD)SpainSri LankaSt. Kitts and NevisSt. LuciaSt. Vincent and the GrenadinesSub-Saharan Africa Sub-Saharan Africa (excluding high income)Sub-Saharan Africa (IDA & IBRD countries)SudanSurinameSwazilandSwedenSwitzerlandSyrian Arab RepublicTajikistanTanzaniaThailandTimor-LesteTogoTongaTrinidad and TobagoTunisiaTurkeyTurkmenistanTurks and Caicos IslandsTuvaluUgandaUkraineUnited Arab EmiratesUnited KingdomUnited StatesUpper middle incomeUruguayVanuatuVenezuela, RBVietnamVirgin Islands (U.S.)WorldYemen, Rep.ZambiaZimbabwe línea de tiempo (timeline):
En esta escala de tiempo se presenta un gráfico de 1963 y 2016 de Latin America & Caribbean (excluding high income). Los datos de 1962 están ausentes. El número de observaciones reales por fecha: 54.
Fuente (nombre):
Indicadores del desarrollo mundial
Fuente (organización):
World Bank staff estimates from the Comtrade database maintained by the United Nations Statistics Division.
Categorías:
Energy & Mining, Private Sector, Trade
Se ha actualizado:
23 abr 2017 año
Los indicadores de los cambios de valor en los últimos años
Mínimo:
4.956
1 ene 1999 año
Máximo:
19.114
1 ene 1985 año
A la fecha de observación
Valor
Cambio absoluto
El cambio con respecto al valor anterior
1 ene 1963 año
7.405
+7.405
0.0%
1 ene 1964 año
7.84
+0.435
5.87%
1 ene 1965 año
8.194
+0.354
4.51%
1 ene 1966 año
8.255
+0.061
0.74%
1 ene 1967 año
7.433
-0.822
-9.96%
1 ene 1968 año
7.189
-0.243
-3.27%
1 ene 1969 año
6.668
-0.521
-7.25%
1 ene 1970 año
6.468
-0.2
-3.01%
1 ene 1971 año
5.929
-0.539
-8.33%
1 ene 1972 año
7.185
+1.256
21.18%
1 ene 1973 año
7.13
-0.055
-0.76%
1 ene 1974 año
8.722
+1.593
22.34%
1 ene 1975 año
12.876
+4.153
47.62%
1 ene 1976 año
12.52
-0.356
-2.77%
1 ene 1977 año
13.804
+1.285
10.26%
1 ene 1978 año
14.012
+0.208
1.5%
1 ene 1979 año
12.879
-1.133
-8.09%
1 ene 1980 año
14.639
+1.761
13.67%
1 ene 1981 año
15.69
+1.05
7.17%
1 ene 1982 año
18.685
+2.995
19.09%
1 ene 1983 año
18.985
+0.3
1.61%
1 ene 1984 año
18.861
-0.124
-0.65%
1 ene 1985 año
19.114
+0.253
1.34%
1 ene 1986 año
18.326
-0.788
-4.12%
1 ene 1987 año
10.86
-7.466
-40.74%
1 ene 1988 año
12.54
+1.68
15.47%
1 ene 1989 año
11.216
-1.324
-10.56%
1 ene 1990 año
11.151
-0.065
-0.58%
1 ene 1991 año
11.41
+0.259
2.32%
1 ene 1992 año
10.101
-1.309
-11.47%
1 ene 1993 año
9.735
-0.366
-3.62%
1 ene 1994 año
8.194
-1.541
-15.83%
1 ene 1995 año
6.428
-1.767
-21.56%
1 ene 1996 año
6.047
-0.381
-5.92%
1 ene 1997 año
6.399
+0.352
5.82%
1 ene 1998 año
6.342
-0.057
-0.9%
1 ene 1999 año
4.956
-1.386
-21.85%
1 ene 2000 año
5.97
+1.015
20.47%
1 ene 2001 año
8.101
+2.13
35.68%
1 ene 2002 año
8.148
+0.047
0.58%
1 ene 2003 año
7.484
-0.664
-8.15%
1 ene 2004 año
8.047
+0.563
7.53%
1 ene 2005 año
9.174
+1.127
14.01%
1 ene 2006 año
10.242
+1.067
11.64%
1 ene 2007 año
10.077
-0.164
-1.6%
1 ene 2008 año
10.643
+0.565
5.61%
1 ene 2009 año
12.147
+1.504
14.14%
1 ene 2010 año
9.755
-2.392
-19.69%
1 ene 2011 año
11.083
+1.328
13.61%
1 ene 2012 año
13.022
+1.938
17.49%
1 ene 2013 año
12.666
-0.356
-2.73%
1 ene 2014 año
12.997
+0.331
2.61%
1 ene 2015 año
14.089
+1.093
8.41%
1 ene 2016 año
10.432
-3.658
-25.96%
Ranking de los países por los datos estadísticos actuales


Comentarios: