29
/es/
es
AIzaSyAYiBZKx7MnpbEhh9jyipgxe19OcubqV5w
April 1, 2024
222174
Peru
PER
true
2
1
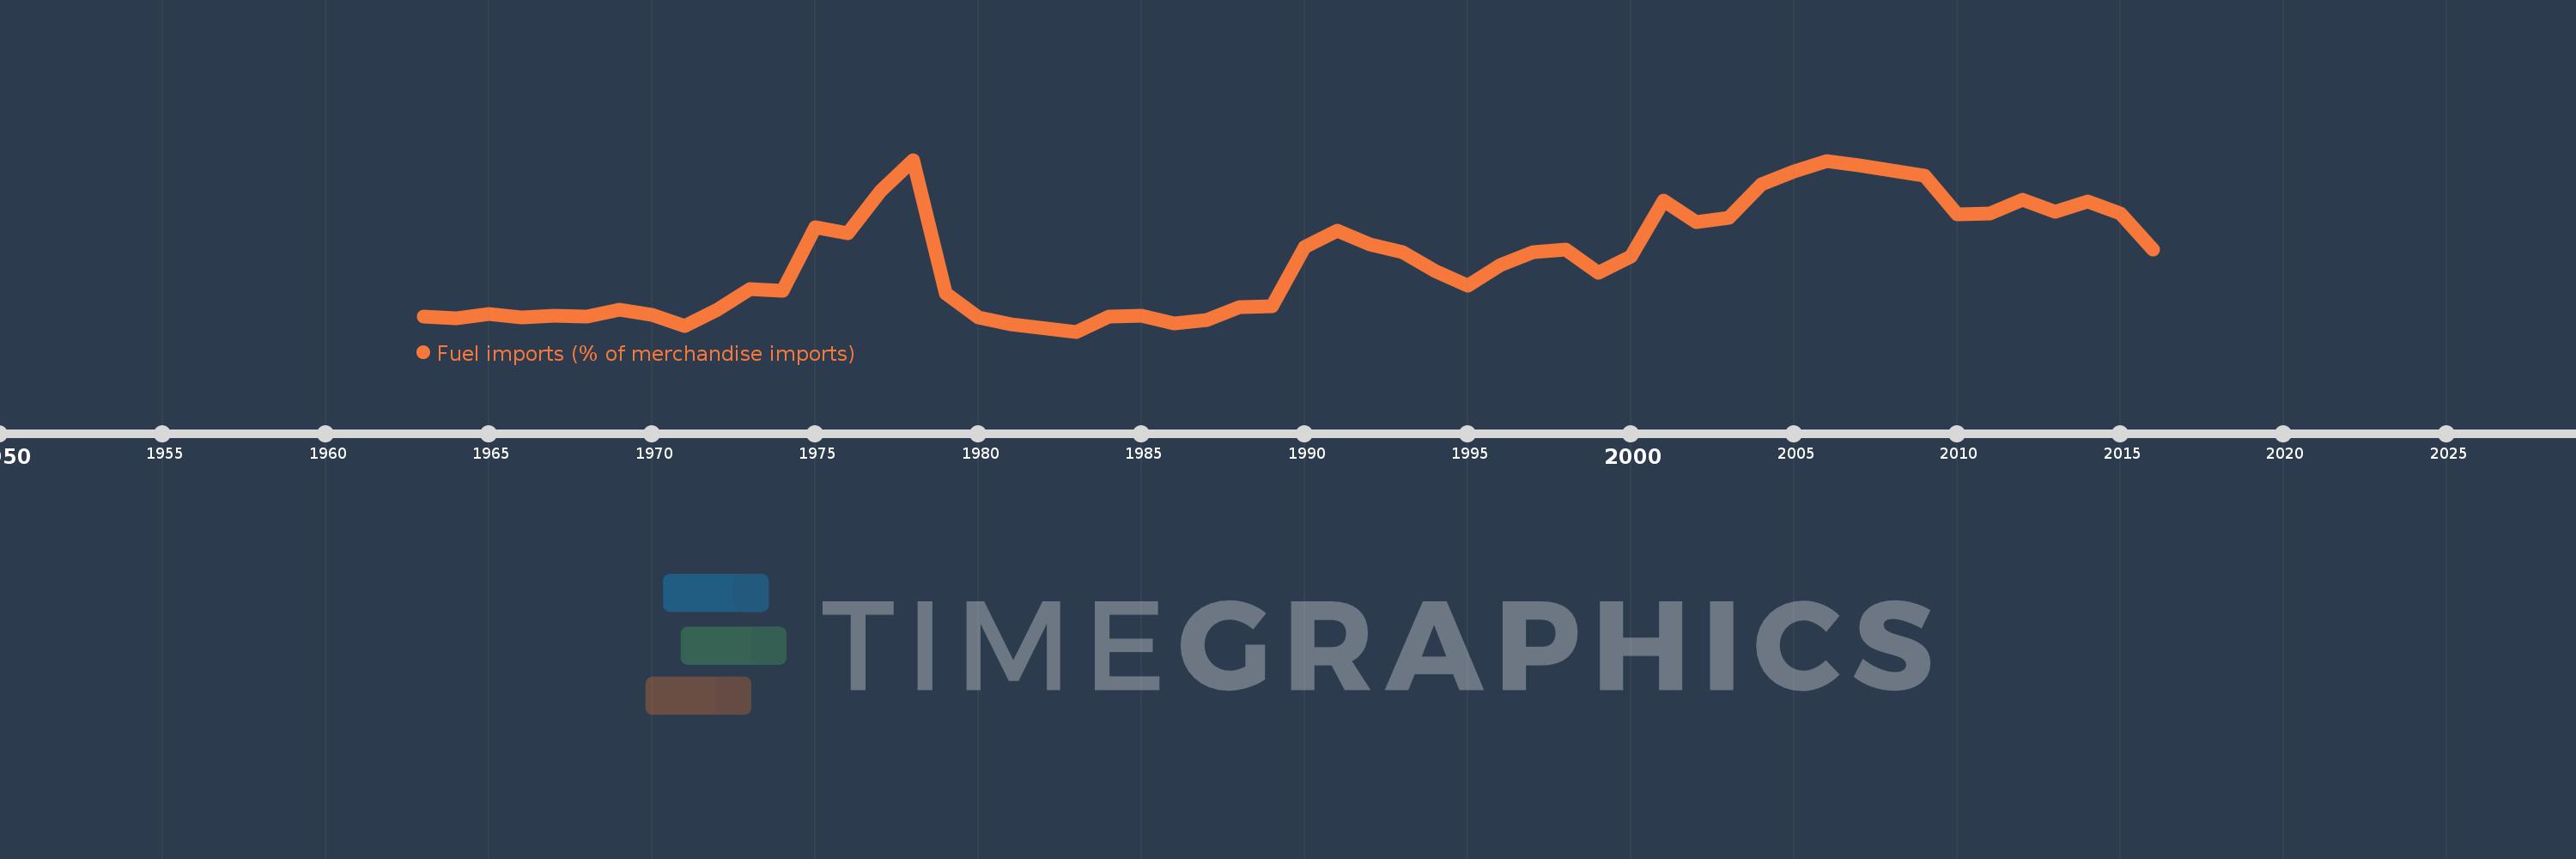
Fuel imports (% of merchandise imports)
2016,2015,2014,2013,2012,2011,2010,2009,2008,2007,2006,2005,2004,2003,2002,2001,2000,1999,1998,1997,1996,1995,1994,1993,1992,1991,1990,1989,1988,1987,1986,1985,1984,1983,1981,1980,1979,1978,1977,1976,1975,1974,1973,1972,1971,1970,1969,1968,1967,1966,1965,1964,1963
Estas estadísticas en otros países:
AfghanistanAlbaniaAlgeriaAndorraAngolaAntigua and BarbudaArab WorldArgentinaArmeniaArubaAustraliaAustriaAzerbaijanBahamas, TheBahrainBangladeshBarbadosBelarusBelgiumBelizeBeninBermudaBhutanBoliviaBosnia and HerzegovinaBotswanaBrazilBrunei DarussalamBulgariaBurkina FasoBurundiCabo VerdeCambodiaCameroonCanadaCaribbean small statesCayman IslandsCentral African RepublicCentral Europe and the BalticsChadChileChinaColombiaComorosCongo, Dem. Rep.Congo, Rep.Costa RicaCote d'IvoireCroatiaCubaCyprusCzech RepublicDenmarkDjiboutiDominicaDominican RepublicEarly-demographic dividendEast Asia & PacificEast Asia & Pacific (excluding high income)East Asia & Pacific (IDA & IBRD countries)EcuadorEgypt, Arab Rep.El SalvadorEquatorial GuineaEritreaEstoniaEthiopiaEuro areaEurope & Central AsiaEurope & Central Asia (excluding high income)Europe & Central Asia (IDA & IBRD countries)European UnionFaroe IslandsFijiFinlandFragile and conflict affected situationsFranceFrench PolynesiaGabonGambia, TheGeorgiaGermanyGhanaGreeceGreenlandGrenadaGuatemalaGuineaGuinea-BissauGuyanaHaitiHeavily indebted poor countries (HIPC)High incomeHondurasHong Kong SAR, ChinaHungaryIBRD onlyIcelandIDA & IBRD totalIDA blendIDA onlyIDA totalIndiaIndonesiaIran, Islamic Rep.IraqIrelandIsraelItalyJamaicaJapanJordanKazakhstanKenyaKiribatiKorea, Rep.KuwaitKyrgyz RepublicLao PDRLate-demographic dividendLatin America & Caribbean Latin America & Caribbean (excluding high income)Latin America & the Caribbean (IDA & IBRD countries)LatviaLeast developed countries: UN classificationLebanonLesothoLiberiaLibyaLithuaniaLow & middle incomeLow incomeLower middle incomeLuxembourgMacao SAR, ChinaMacedonia, FYRMadagascarMalawiMalaysiaMaldivesMaliMaltaMauritaniaMauritiusMexicoMiddle East & North AfricaMiddle East & North Africa (excluding high income)Middle East & North Africa (IDA & IBRD countries)Middle incomeMoldovaMongoliaMoroccoMozambiqueMyanmarNamibiaNepalNetherlandsNew CaledoniaNew ZealandNicaraguaNigerNigeriaNorth AmericaNorwayOECD membersOmanOther small statesPacific island small statesPakistanPalauPanamaPapua New GuineaParaguayPeruPhilippinesPolandPortugalPost-demographic dividendPre-demographic dividendQatarRomaniaRussian FederationRwandaSamoaSao Tome and PrincipeSaudi ArabiaSenegalSerbiaSeychellesSierra LeoneSingaporeSlovak RepublicSloveniaSmall statesSolomon IslandsSomaliaSouth AfricaSouth AsiaSouth Asia (IDA & IBRD)SpainSri LankaSt. Kitts and NevisSt. LuciaSt. Vincent and the GrenadinesSub-Saharan Africa Sub-Saharan Africa (excluding high income)Sub-Saharan Africa (IDA & IBRD countries)SudanSurinameSwazilandSwedenSwitzerlandSyrian Arab RepublicTajikistanTanzaniaThailandTimor-LesteTogoTongaTrinidad and TobagoTunisiaTurkeyTurkmenistanTurks and Caicos IslandsTuvaluUgandaUkraineUnited Arab EmiratesUnited KingdomUnited StatesUpper middle incomeUruguayVanuatuVenezuela, RBVietnamVirgin Islands (U.S.)WorldYemen, Rep.ZambiaZimbabwe línea de tiempo (timeline):
En esta escala de tiempo se presenta un gráfico de 1963 y 2016 de Peru. Los datos de 1962 están ausentes. El número de observaciones reales por fecha: 53.
Fuente (nombre):
Indicadores del desarrollo mundial
Fuente (organización):
World Bank staff estimates from the Comtrade database maintained by the United Nations Statistics Division.
Categorías:
Energy & Mining, Private Sector, Trade
Se ha actualizado:
23 abr 2017 año
Los indicadores de los cambios de valor en los últimos años
Mínimo:
1.669
1 ene 1983 año
Máximo:
19.975
1 ene 1978 año
A la fecha de observación
Valor
Cambio absoluto
El cambio con respecto al valor anterior
1 ene 1963 año
3.313
+3.313
0.0%
1 ene 1964 año
3.125
-0.187
-5.66%
1 ene 1965 año
3.512
+0.386
12.36%
1 ene 1966 año
3.183
-0.329
-9.37%
1 ene 1967 año
3.36
+0.177
5.57%
1 ene 1968 año
3.25
-0.109
-3.26%
1 ene 1969 año
4.037
+0.786
24.19%
1 ene 1970 año
3.497
-0.54
-13.38%
1 ene 1971 año
2.293
-1.204
-34.42%
1 ene 1972 año
4.038
+1.745
76.11%
1 ene 1973 año
6.164
+2.126
52.65%
1 ene 1974 año
6.023
-0.141
-2.29%
1 ene 1975 año
12.832
+6.809
113.05%
1 ene 1976 año
12.109
-0.723
-5.63%
1 ene 1977 año
16.619
+4.51
37.24%
1 ene 1978 año
19.975
+3.357
20.2%
1 ene 1979 año
5.703
-14.272
-71.45%
1 ene 1980 año
3.196
-2.506
-43.95%
1 ene 1981 año
2.447
-0.749
-23.44%
1 ene 1983 año
1.669
-0.778
-31.8%
1 ene 1984 año
3.309
+1.639
98.22%
1 ene 1985 año
3.373
+0.064
1.95%
1 ene 1986 año
2.513
-0.86
-25.51%
1 ene 1987 año
2.88
+0.368
14.63%
1 ene 1988 año
4.235
+1.355
47.03%
1 ene 1989 año
4.331
+0.096
2.27%
1 ene 1990 año
10.654
+6.323
146.0%
1 ene 1991 año
12.46
+1.806
16.95%
1 ene 1992 año
10.969
-1.491
-11.96%
1 ene 1993 año
10.111
-0.858
-7.82%
1 ene 1994 año
8.114
-1.997
-19.75%
1 ene 1995 año
6.525
-1.589
-19.58%
1 ene 1996 año
8.785
+2.259
34.62%
1 ene 1997 año
10.148
+1.363
15.52%
1 ene 1998 año
10.373
+0.225
2.22%
1 ene 1999 año
7.92
-2.453
-23.65%
1 ene 2000 año
9.709
+1.789
22.59%
1 ene 2001 año
15.635
+5.926
61.03%
1 ene 2002 año
13.299
-2.336
-14.94%
1 ene 2003 año
13.837
+0.539
4.05%
1 ene 2004 año
17.363
+3.525
25.48%
1 ene 2005 año
18.718
+1.355
7.8%
1 ene 2006 año
19.801
+1.084
5.79%
1 ene 2007 año
19.361
-0.441
-2.22%
1 ene 2008 año
18.795
-0.566
-2.92%
1 ene 2009 año
18.284
-0.511
-2.72%
1 ene 2010 año
14.183
-4.1
-22.43%
1 ene 2011 año
14.248
+0.065
0.46%
1 ene 2012 año
15.741
+1.493
10.48%
1 ene 2013 año
14.478
-1.263
-8.02%
1 ene 2014 año
15.491
+1.013
7.0%
1 ene 2015 año
14.237
-1.254
-8.1%
1 ene 2016 año
10.407
-3.83
-26.9%
Ranking de los países por los datos estadísticos actuales


Comentarios: