29
/es/
es
AIzaSyAYiBZKx7MnpbEhh9jyipgxe19OcubqV5w
April 1, 2024
191393
Malta
MLT
true
2
1
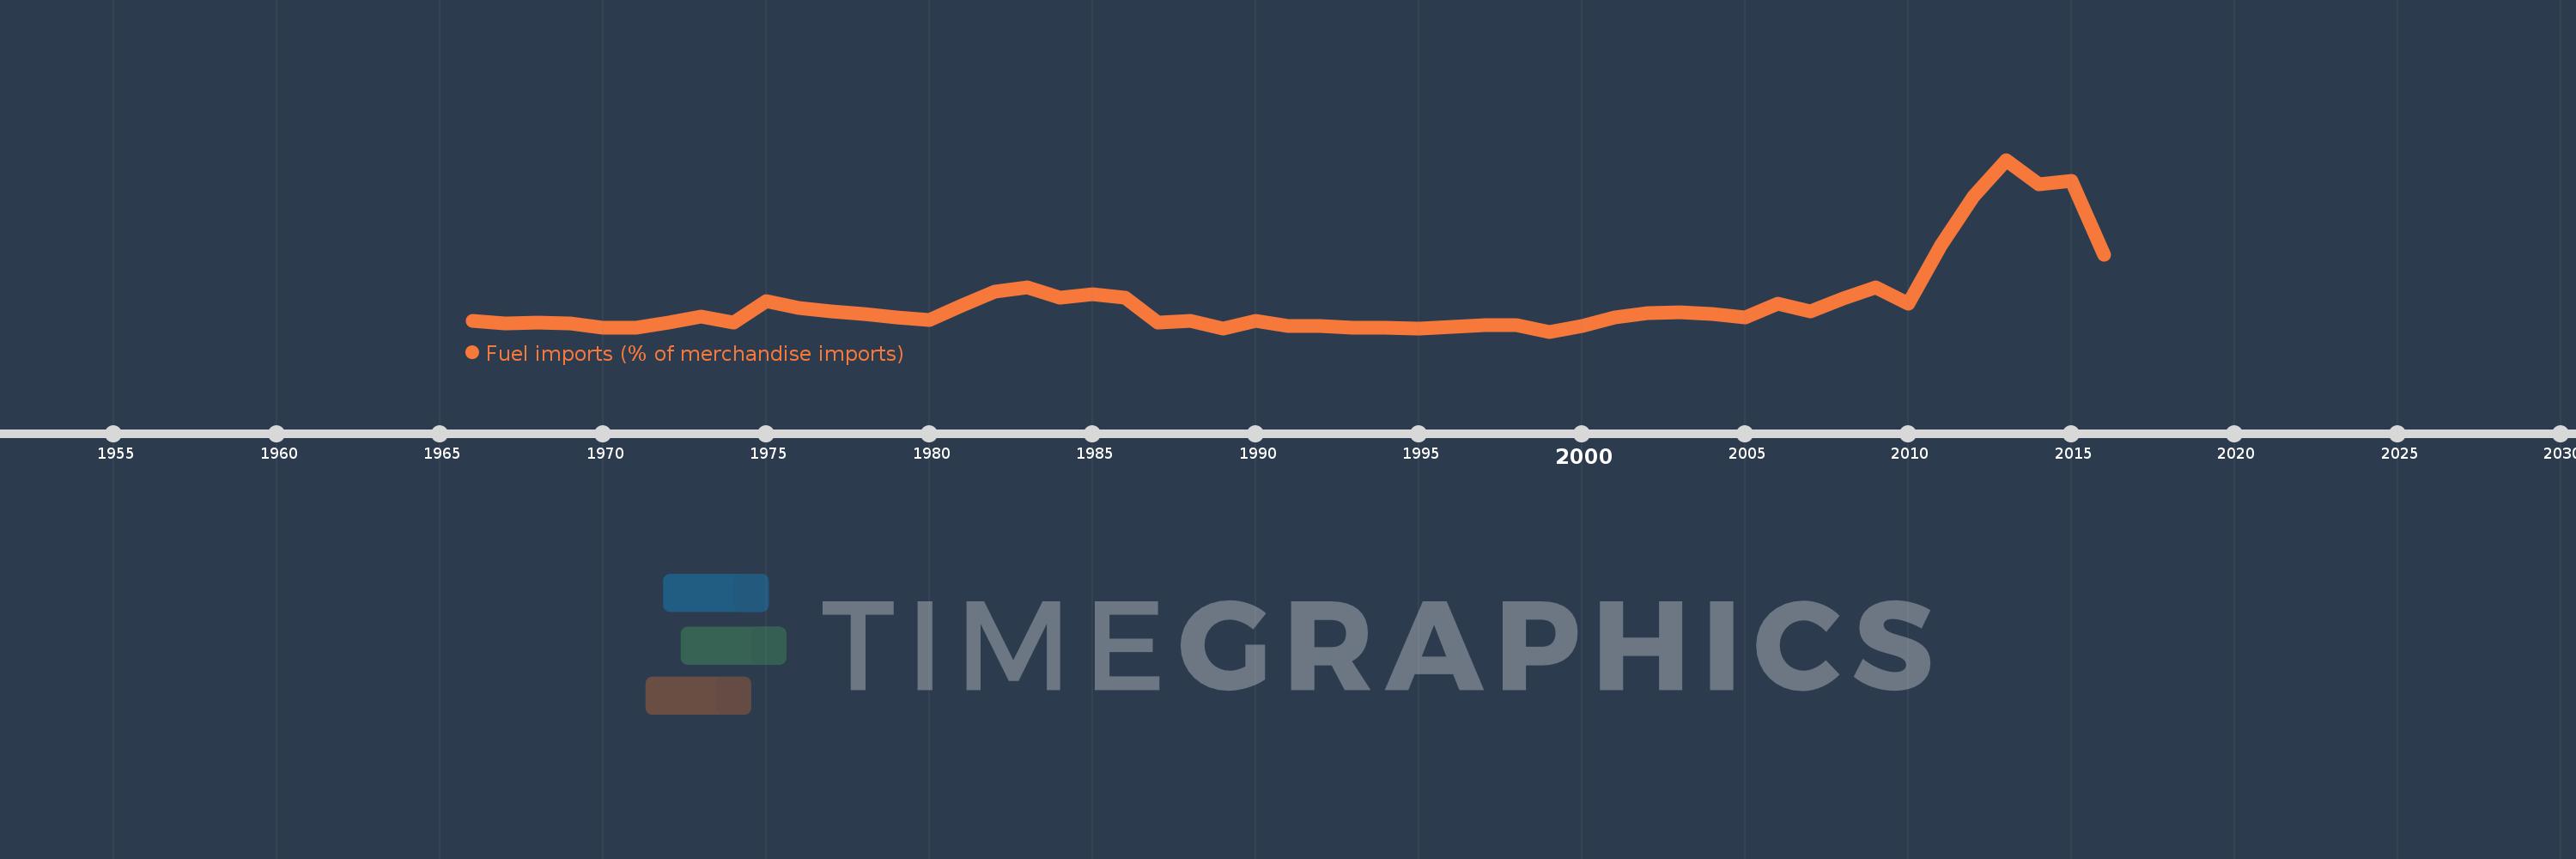
Fuel imports (% of merchandise imports)
2016,2015,2014,2013,2012,2011,2010,2009,2008,2007,2006,2005,2004,2003,2002,2001,2000,1999,1998,1997,1995,1994,1993,1992,1991,1990,1989,1988,1987,1986,1985,1984,1983,1982,1981,1980,1979,1978,1977,1976,1975,1974,1973,1972,1971,1970,1969,1968,1967,1966
Estas estadísticas en otros países:
AfghanistanAlbaniaAlgeriaAndorraAngolaAntigua and BarbudaArab WorldArgentinaArmeniaArubaAustraliaAustriaAzerbaijanBahamas, TheBahrainBangladeshBarbadosBelarusBelgiumBelizeBeninBermudaBhutanBoliviaBosnia and HerzegovinaBotswanaBrazilBrunei DarussalamBulgariaBurkina FasoBurundiCabo VerdeCambodiaCameroonCanadaCaribbean small statesCayman IslandsCentral African RepublicCentral Europe and the BalticsChadChileChinaColombiaComorosCongo, Dem. Rep.Congo, Rep.Costa RicaCote d'IvoireCroatiaCubaCyprusCzech RepublicDenmarkDjiboutiDominicaDominican RepublicEarly-demographic dividendEast Asia & PacificEast Asia & Pacific (excluding high income)East Asia & Pacific (IDA & IBRD countries)EcuadorEgypt, Arab Rep.El SalvadorEquatorial GuineaEritreaEstoniaEthiopiaEuro areaEurope & Central AsiaEurope & Central Asia (excluding high income)Europe & Central Asia (IDA & IBRD countries)European UnionFaroe IslandsFijiFinlandFragile and conflict affected situationsFranceFrench PolynesiaGabonGambia, TheGeorgiaGermanyGhanaGreeceGreenlandGrenadaGuatemalaGuineaGuinea-BissauGuyanaHaitiHeavily indebted poor countries (HIPC)High incomeHondurasHong Kong SAR, ChinaHungaryIBRD onlyIcelandIDA & IBRD totalIDA blendIDA onlyIDA totalIndiaIndonesiaIran, Islamic Rep.IraqIrelandIsraelItalyJamaicaJapanJordanKazakhstanKenyaKiribatiKorea, Rep.KuwaitKyrgyz RepublicLao PDRLate-demographic dividendLatin America & Caribbean Latin America & Caribbean (excluding high income)Latin America & the Caribbean (IDA & IBRD countries)LatviaLeast developed countries: UN classificationLebanonLesothoLiberiaLibyaLithuaniaLow & middle incomeLow incomeLower middle incomeLuxembourgMacao SAR, ChinaMacedonia, FYRMadagascarMalawiMalaysiaMaldivesMaliMaltaMauritaniaMauritiusMexicoMiddle East & North AfricaMiddle East & North Africa (excluding high income)Middle East & North Africa (IDA & IBRD countries)Middle incomeMoldovaMongoliaMoroccoMozambiqueMyanmarNamibiaNepalNetherlandsNew CaledoniaNew ZealandNicaraguaNigerNigeriaNorth AmericaNorwayOECD membersOmanOther small statesPacific island small statesPakistanPalauPanamaPapua New GuineaParaguayPeruPhilippinesPolandPortugalPost-demographic dividendPre-demographic dividendQatarRomaniaRussian FederationRwandaSamoaSao Tome and PrincipeSaudi ArabiaSenegalSerbiaSeychellesSierra LeoneSingaporeSlovak RepublicSloveniaSmall statesSolomon IslandsSomaliaSouth AfricaSouth AsiaSouth Asia (IDA & IBRD)SpainSri LankaSt. Kitts and NevisSt. LuciaSt. Vincent and the GrenadinesSub-Saharan Africa Sub-Saharan Africa (excluding high income)Sub-Saharan Africa (IDA & IBRD countries)SudanSurinameSwazilandSwedenSwitzerlandSyrian Arab RepublicTajikistanTanzaniaThailandTimor-LesteTogoTongaTrinidad and TobagoTunisiaTurkeyTurkmenistanTurks and Caicos IslandsTuvaluUgandaUkraineUnited Arab EmiratesUnited KingdomUnited StatesUpper middle incomeUruguayVanuatuVenezuela, RBVietnamVirgin Islands (U.S.)WorldYemen, Rep.ZambiaZimbabwe línea de tiempo (timeline):
En esta escala de tiempo se presenta un gráfico de 1966 y 2016 de Malta. Los datos de 1965 están ausentes. El número de observaciones reales por fecha: 50.
Fuente (nombre):
Indicadores del desarrollo mundial
Fuente (organización):
World Bank staff estimates from the Comtrade database maintained by the United Nations Statistics Division.
Categorías:
Energy & Mining, Private Sector, Trade
Se ha actualizado:
23 abr 2017 año
Los indicadores de los cambios de valor en los últimos años
Mínimo:
3.849
1 ene 1999 año
Máximo:
45.486
1 ene 2013 año
A la fecha de observación
Valor
Cambio absoluto
El cambio con respecto al valor anterior
1 ene 1966 año
6.412
+6.412
0.0%
1 ene 1967 año
5.87
-0.542
-8.45%
1 ene 1968 año
6.058
+0.188
3.21%
1 ene 1969 año
5.89
-0.168
-2.78%
1 ene 1970 año
4.838
-1.052
-17.86%
1 ene 1971 año
4.854
+0.016
0.33%
1 ene 1972 año
6.117
+1.263
26.03%
1 ene 1973 año
7.47
+1.353
22.11%
1 ene 1974 año
6.028
-1.442
-19.3%
1 ene 1975 año
11.315
+5.287
87.71%
1 ene 1976 año
9.51
-1.805
-15.95%
1 ene 1977 año
8.801
-0.709
-7.46%
1 ene 1978 año
8.084
-0.717
-8.14%
1 ene 1979 año
7.34
-0.744
-9.2%
1 ene 1980 año
6.625
-0.715
-9.74%
1 ene 1981 año
10.284
+3.659
55.23%
1 ene 1982 año
13.456
+3.172
30.84%
1 ene 1983 año
14.618
+1.162
8.64%
1 ene 1984 año
12.167
-2.45
-16.76%
1 ene 1985 año
12.918
+0.75
6.17%
1 ene 1986 año
12.102
-0.815
-6.31%
1 ene 1987 año
6.072
-6.03
-49.83%
1 ene 1988 año
6.501
+0.429
7.06%
1 ene 1989 año
4.623
-1.878
-28.89%
1 ene 1990 año
6.366
+1.743
37.71%
1 ene 1991 año
5.223
-1.143
-17.96%
1 ene 1992 año
5.134
-0.089
-1.71%
1 ene 1993 año
4.758
-0.376
-7.33%
1 ene 1994 año
4.738
-0.02
-0.42%
1 ene 1995 año
4.507
-0.23
-4.86%
1 ene 1997 año
5.5
+0.993
22.03%
1 ene 1998 año
5.335
-0.166
-3.01%
1 ene 1999 año
3.849
-1.486
-27.85%
1 ene 2000 año
5.236
+1.387
36.04%
1 ene 2001 año
7.2
+1.964
37.51%
1 ene 2002 año
8.407
+1.207
16.77%
1 ene 2003 año
8.469
+0.062
0.73%
1 ene 2004 año
8.039
-0.43
-5.08%
1 ene 2005 año
7.193
-0.845
-10.51%
1 ene 2006 año
10.588
+3.394
47.19%
1 ene 2007 año
8.838
-1.75
-16.53%
1 ene 2008 año
11.864
+3.026
34.24%
1 ene 2009 año
14.648
+2.784
23.47%
1 ene 2010 año
10.655
-3.992
-27.26%
1 ene 2011 año
24.682
+14.027
131.65%
1 ene 2012 año
36.607
+11.925
48.31%
1 ene 2013 año
45.486
+8.879
24.25%
1 ene 2014 año
39.451
-6.035
-13.27%
1 ene 2015 año
40.336
+0.885
2.24%
1 ene 2016 año
22.471
-17.866
-44.29%
Ranking de los países por los datos estadísticos actuales


Comentarios: