29
/es/
es
AIzaSyAYiBZKx7MnpbEhh9jyipgxe19OcubqV5w
April 1, 2024
47124
Lower middle income
LMC
false
2
1
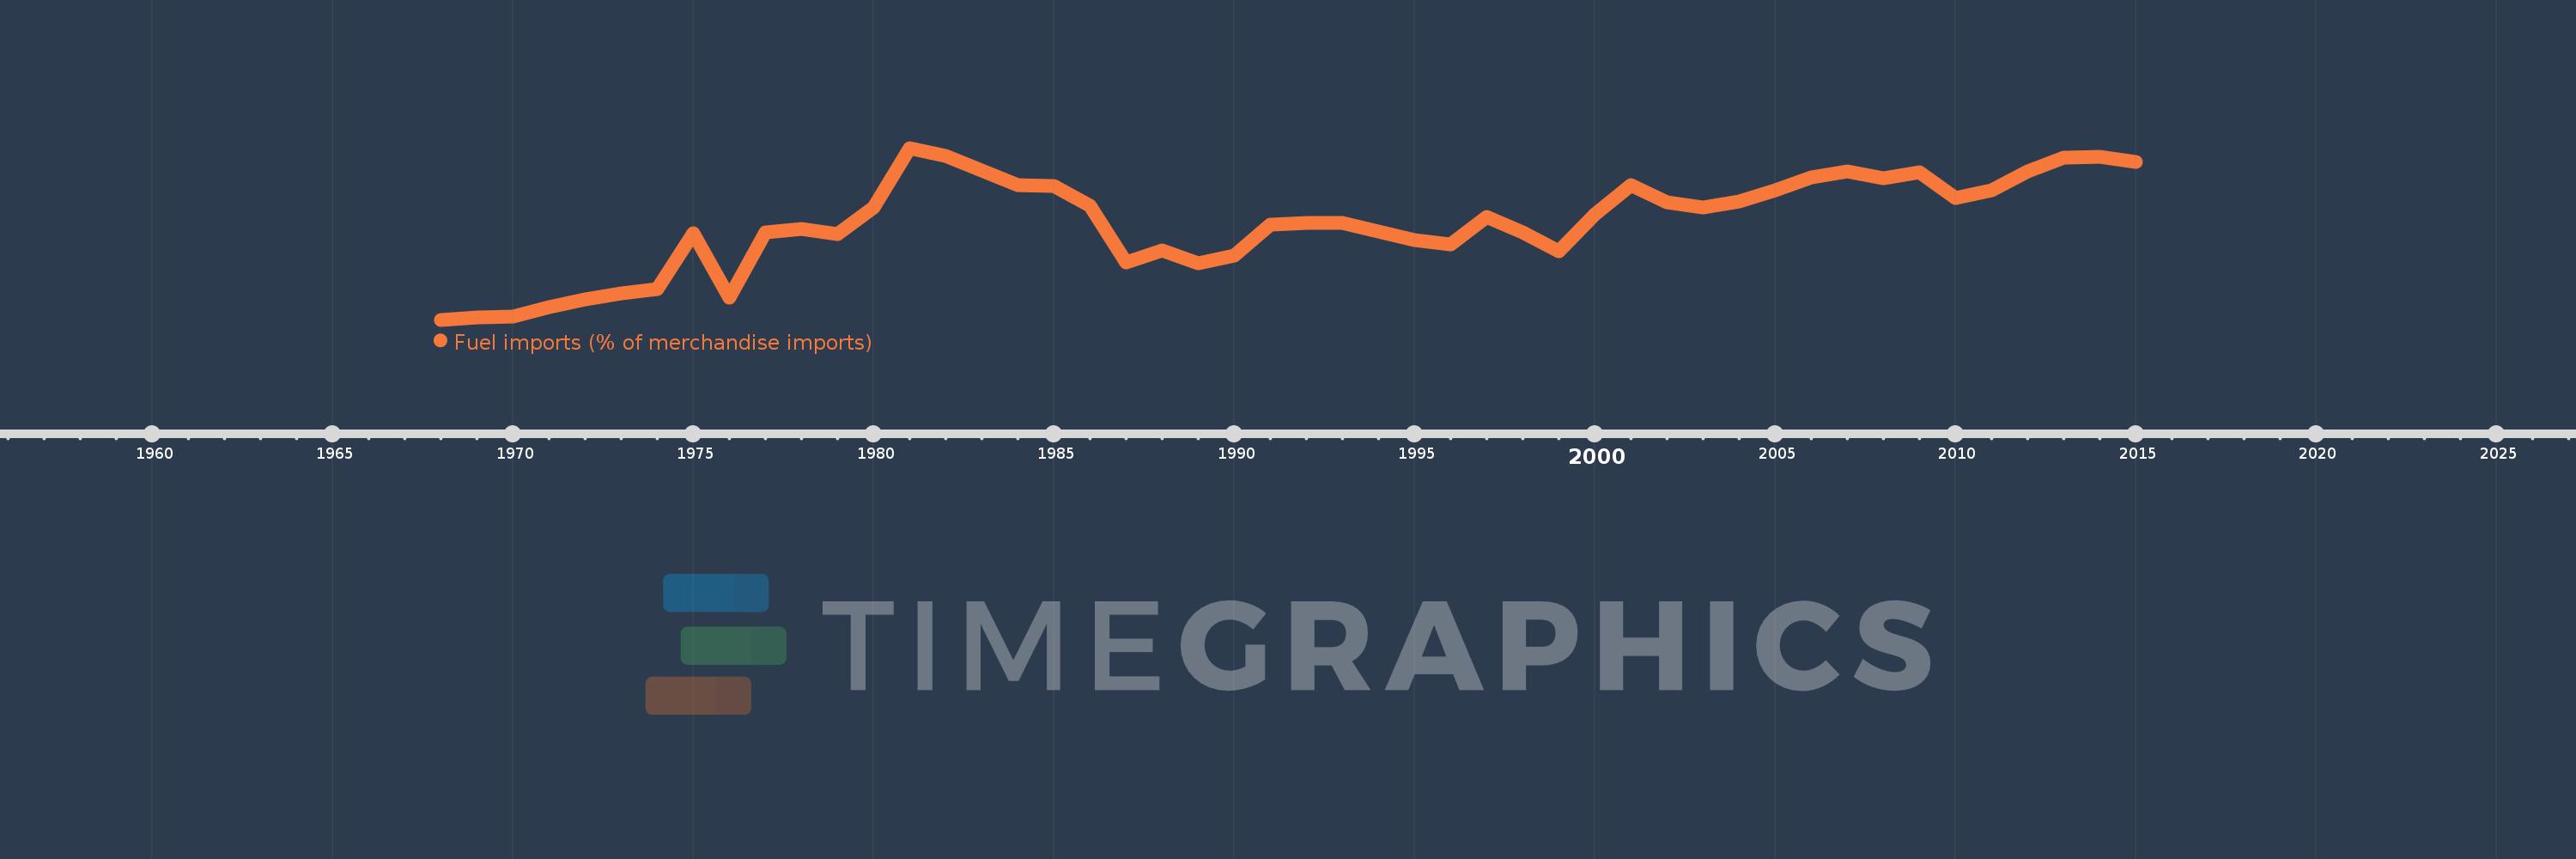
Fuel imports (% of merchandise imports)
2015,2014,2013,2012,2011,2010,2009,2008,2007,2006,2005,2004,2003,2002,2001,2000,1999,1998,1997,1996,1995,1994,1993,1992,1991,1990,1989,1988,1987,1986,1985,1984,1982,1981,1980,1979,1978,1977,1976,1975,1974,1973,1972,1971,1970,1969,1968
Estas estadísticas en otros países:
AfghanistanAlbaniaAlgeriaAndorraAngolaAntigua and BarbudaArab WorldArgentinaArmeniaArubaAustraliaAustriaAzerbaijanBahamas, TheBahrainBangladeshBarbadosBelarusBelgiumBelizeBeninBermudaBhutanBoliviaBosnia and HerzegovinaBotswanaBrazilBrunei DarussalamBulgariaBurkina FasoBurundiCabo VerdeCambodiaCameroonCanadaCaribbean small statesCayman IslandsCentral African RepublicCentral Europe and the BalticsChadChileChinaColombiaComorosCongo, Dem. Rep.Congo, Rep.Costa RicaCote d'IvoireCroatiaCubaCyprusCzech RepublicDenmarkDjiboutiDominicaDominican RepublicEarly-demographic dividendEast Asia & PacificEast Asia & Pacific (excluding high income)East Asia & Pacific (IDA & IBRD countries)EcuadorEgypt, Arab Rep.El SalvadorEquatorial GuineaEritreaEstoniaEthiopiaEuro areaEurope & Central AsiaEurope & Central Asia (excluding high income)Europe & Central Asia (IDA & IBRD countries)European UnionFaroe IslandsFijiFinlandFragile and conflict affected situationsFranceFrench PolynesiaGabonGambia, TheGeorgiaGermanyGhanaGreeceGreenlandGrenadaGuatemalaGuineaGuinea-BissauGuyanaHaitiHeavily indebted poor countries (HIPC)High incomeHondurasHong Kong SAR, ChinaHungaryIBRD onlyIcelandIDA & IBRD totalIDA blendIDA onlyIDA totalIndiaIndonesiaIran, Islamic Rep.IraqIrelandIsraelItalyJamaicaJapanJordanKazakhstanKenyaKiribatiKorea, Rep.KuwaitKyrgyz RepublicLao PDRLate-demographic dividendLatin America & Caribbean Latin America & Caribbean (excluding high income)Latin America & the Caribbean (IDA & IBRD countries)LatviaLeast developed countries: UN classificationLebanonLesothoLiberiaLibyaLithuaniaLow & middle incomeLow incomeLower middle incomeLuxembourgMacao SAR, ChinaMacedonia, FYRMadagascarMalawiMalaysiaMaldivesMaliMaltaMauritaniaMauritiusMexicoMiddle East & North AfricaMiddle East & North Africa (excluding high income)Middle East & North Africa (IDA & IBRD countries)Middle incomeMoldovaMongoliaMoroccoMozambiqueMyanmarNamibiaNepalNetherlandsNew CaledoniaNew ZealandNicaraguaNigerNigeriaNorth AmericaNorwayOECD membersOmanOther small statesPacific island small statesPakistanPalauPanamaPapua New GuineaParaguayPeruPhilippinesPolandPortugalPost-demographic dividendPre-demographic dividendQatarRomaniaRussian FederationRwandaSamoaSao Tome and PrincipeSaudi ArabiaSenegalSerbiaSeychellesSierra LeoneSingaporeSlovak RepublicSloveniaSmall statesSolomon IslandsSomaliaSouth AfricaSouth AsiaSouth Asia (IDA & IBRD)SpainSri LankaSt. Kitts and NevisSt. LuciaSt. Vincent and the GrenadinesSub-Saharan Africa Sub-Saharan Africa (excluding high income)Sub-Saharan Africa (IDA & IBRD countries)SudanSurinameSwazilandSwedenSwitzerlandSyrian Arab RepublicTajikistanTanzaniaThailandTimor-LesteTogoTongaTrinidad and TobagoTunisiaTurkeyTurkmenistanTurks and Caicos IslandsTuvaluUgandaUkraineUnited Arab EmiratesUnited KingdomUnited StatesUpper middle incomeUruguayVanuatuVenezuela, RBVietnamVirgin Islands (U.S.)WorldYemen, Rep.ZambiaZimbabwe línea de tiempo (timeline):
En esta escala de tiempo se presenta un gráfico de 1968 y 2015 de Lower middle income. Los datos de 1967 están ausentes. El número de observaciones reales por fecha: 47.
Fuente (nombre):
Indicadores del desarrollo mundial
Fuente (organización):
World Bank staff estimates from the Comtrade database maintained by the United Nations Statistics Division.
Categorías:
Energy & Mining, Private Sector, Trade
Se ha actualizado:
23 abr 2017 año
Los indicadores de los cambios de valor en los últimos años
Mínimo:
4.541
1 ene 1968 año
Máximo:
29.373
1 ene 1981 año
A la fecha de observación
Valor
Cambio absoluto
El cambio con respecto al valor anterior
1 ene 1968 año
4.541
+4.541
0.0%
1 ene 1969 año
4.872
+0.331
7.28%
1 ene 1970 año
4.967
+0.096
1.96%
1 ene 1971 año
6.391
+1.424
28.66%
1 ene 1972 año
7.532
+1.141
17.85%
1 ene 1973 año
8.343
+0.811
10.77%
1 ene 1974 año
8.944
+0.601
7.21%
1 ene 1975 año
16.986
+8.041
89.9%
1 ene 1976 año
7.733
-9.253
-54.47%
1 ene 1977 año
17.147
+9.414
121.73%
1 ene 1978 año
17.687
+0.539
3.15%
1 ene 1979 año
16.902
-0.785
-4.44%
1 ene 1980 año
20.713
+3.811
22.54%
1 ene 1981 año
29.373
+8.66
41.81%
1 ene 1982 año
28.16
-1.213
-4.13%
1 ene 1984 año
24.05
-4.11
-14.59%
1 ene 1985 año
23.895
-0.154
-0.64%
1 ene 1986 año
21.049
-2.847
-11.91%
1 ene 1987 año
12.813
-8.236
-39.13%
1 ene 1988 año
14.519
+1.706
13.32%
1 ene 1989 año
12.759
-1.76
-12.12%
1 ene 1990 año
13.872
+1.113
8.72%
1 ene 1991 año
18.322
+4.451
32.08%
1 ene 1992 año
18.542
+0.219
1.2%
1 ene 1993 año
18.589
+0.047
0.26%
1 ene 1994 año
17.351
-1.238
-6.66%
1 ene 1995 año
16.065
-1.286
-7.41%
1 ene 1996 año
15.399
-0.666
-4.15%
1 ene 1997 año
19.407
+4.008
26.03%
1 ene 1998 año
17.121
-2.286
-11.78%
1 ene 1999 año
14.488
-2.633
-15.38%
1 ene 2000 año
19.775
+5.287
36.5%
1 ene 2001 año
23.991
+4.216
21.32%
1 ene 2002 año
21.47
-2.521
-10.51%
1 ene 2003 año
20.746
-0.724
-3.37%
1 ene 2004 año
21.578
+0.833
4.01%
1 ene 2005 año
23.303
+1.725
7.99%
1 ene 2006 año
25.151
+1.848
7.93%
1 ene 2007 año
26.01
+0.859
3.41%
1 ene 2008 año
25.026
-0.984
-3.78%
1 ene 2009 año
25.8
+0.774
3.09%
1 ene 2010 año
22.178
-3.623
-14.04%
1 ene 2011 año
23.268
+1.09
4.92%
1 ene 2012 año
26.012
+2.744
11.79%
1 ene 2013 año
27.978
+1.966
7.56%
1 ene 2014 año
28.123
+0.146
0.52%
1 ene 2015 año
27.309
-0.814
-2.89%
Ranking de los países por los datos estadísticos actuales


Comentarios: