29
/es/
es
AIzaSyAYiBZKx7MnpbEhh9jyipgxe19OcubqV5w
April 1, 2024
110926
Congo, Rep.
COG
true
2
1
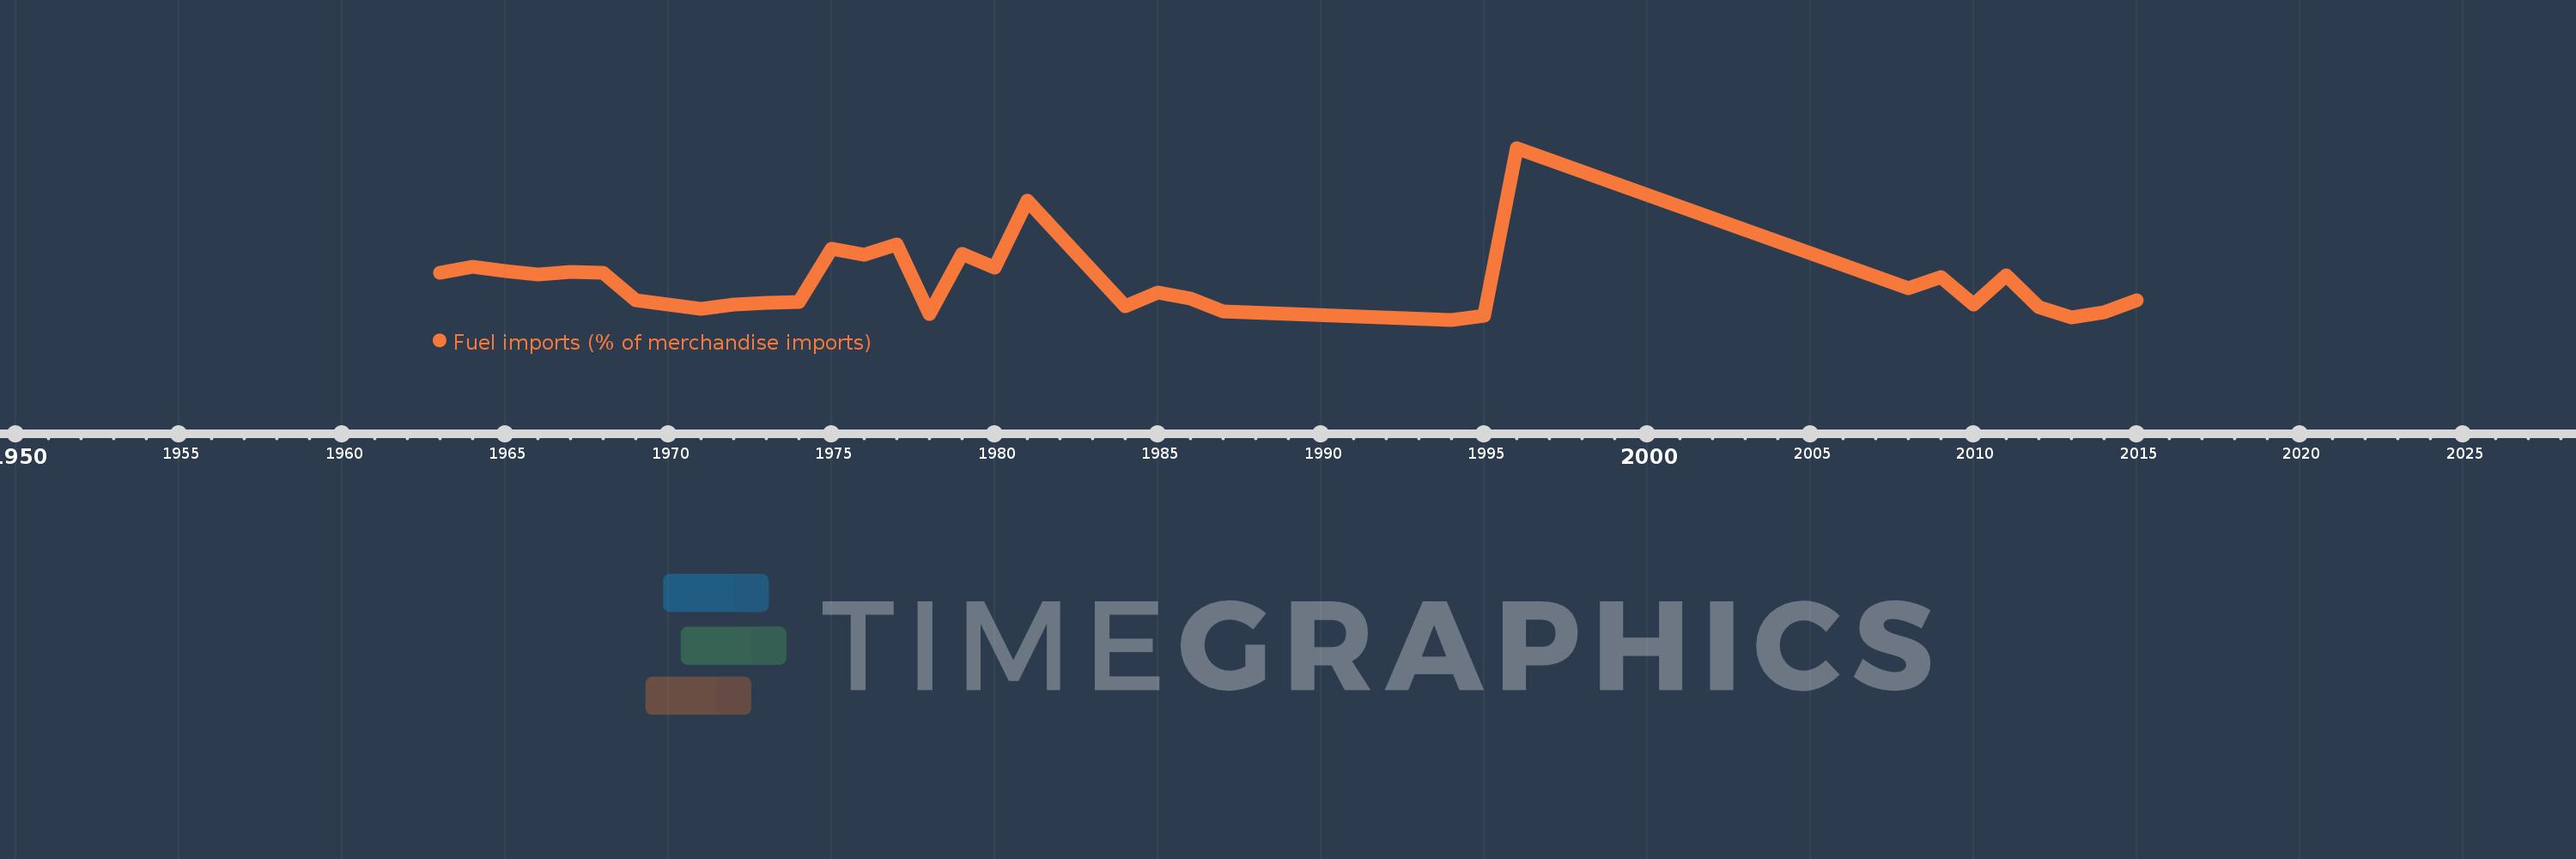
Fuel imports (% of merchandise imports)
2015,2014,2013,2012,2011,2010,2009,2008,1996,1995,1994,1987,1986,1985,1984,1981,1980,1979,1978,1977,1976,1975,1974,1973,1972,1971,1969,1968,1967,1966,1965,1964,1963
Estas estadísticas en otros países:
AfghanistanAlbaniaAlgeriaAndorraAngolaAntigua and BarbudaArab WorldArgentinaArmeniaArubaAustraliaAustriaAzerbaijanBahamas, TheBahrainBangladeshBarbadosBelarusBelgiumBelizeBeninBermudaBhutanBoliviaBosnia and HerzegovinaBotswanaBrazilBrunei DarussalamBulgariaBurkina FasoBurundiCabo VerdeCambodiaCameroonCanadaCaribbean small statesCayman IslandsCentral African RepublicCentral Europe and the BalticsChadChileChinaColombiaComorosCongo, Dem. Rep.Congo, Rep.Costa RicaCote d'IvoireCroatiaCubaCyprusCzech RepublicDenmarkDjiboutiDominicaDominican RepublicEarly-demographic dividendEast Asia & PacificEast Asia & Pacific (excluding high income)East Asia & Pacific (IDA & IBRD countries)EcuadorEgypt, Arab Rep.El SalvadorEquatorial GuineaEritreaEstoniaEthiopiaEuro areaEurope & Central AsiaEurope & Central Asia (excluding high income)Europe & Central Asia (IDA & IBRD countries)European UnionFaroe IslandsFijiFinlandFragile and conflict affected situationsFranceFrench PolynesiaGabonGambia, TheGeorgiaGermanyGhanaGreeceGreenlandGrenadaGuatemalaGuineaGuinea-BissauGuyanaHaitiHeavily indebted poor countries (HIPC)High incomeHondurasHong Kong SAR, ChinaHungaryIBRD onlyIcelandIDA & IBRD totalIDA blendIDA onlyIDA totalIndiaIndonesiaIran, Islamic Rep.IraqIrelandIsraelItalyJamaicaJapanJordanKazakhstanKenyaKiribatiKorea, Rep.KuwaitKyrgyz RepublicLao PDRLate-demographic dividendLatin America & Caribbean Latin America & Caribbean (excluding high income)Latin America & the Caribbean (IDA & IBRD countries)LatviaLeast developed countries: UN classificationLebanonLesothoLiberiaLibyaLithuaniaLow & middle incomeLow incomeLower middle incomeLuxembourgMacao SAR, ChinaMacedonia, FYRMadagascarMalawiMalaysiaMaldivesMaliMaltaMauritaniaMauritiusMexicoMiddle East & North AfricaMiddle East & North Africa (excluding high income)Middle East & North Africa (IDA & IBRD countries)Middle incomeMoldovaMongoliaMoroccoMozambiqueMyanmarNamibiaNepalNetherlandsNew CaledoniaNew ZealandNicaraguaNigerNigeriaNorth AmericaNorwayOECD membersOmanOther small statesPacific island small statesPakistanPalauPanamaPapua New GuineaParaguayPeruPhilippinesPolandPortugalPost-demographic dividendPre-demographic dividendQatarRomaniaRussian FederationRwandaSamoaSao Tome and PrincipeSaudi ArabiaSenegalSerbiaSeychellesSierra LeoneSingaporeSlovak RepublicSloveniaSmall statesSolomon IslandsSomaliaSouth AfricaSouth AsiaSouth Asia (IDA & IBRD)SpainSri LankaSt. Kitts and NevisSt. LuciaSt. Vincent and the GrenadinesSub-Saharan Africa Sub-Saharan Africa (excluding high income)Sub-Saharan Africa (IDA & IBRD countries)SudanSurinameSwazilandSwedenSwitzerlandSyrian Arab RepublicTajikistanTanzaniaThailandTimor-LesteTogoTongaTrinidad and TobagoTunisiaTurkeyTurkmenistanTurks and Caicos IslandsTuvaluUgandaUkraineUnited Arab EmiratesUnited KingdomUnited StatesUpper middle incomeUruguayVanuatuVenezuela, RBVietnamVirgin Islands (U.S.)WorldYemen, Rep.ZambiaZimbabwe línea de tiempo (timeline):
En esta escala de tiempo se presenta un gráfico de 1963 y 2015 de Congo, Rep.. Los datos de 1962 están ausentes. El número de observaciones reales por fecha: 33.
Fuente (nombre):
Indicadores del desarrollo mundial
Fuente (organización):
World Bank staff estimates from the Comtrade database maintained by the United Nations Statistics Division.
Categorías:
Energy & Mining, Private Sector, Trade
Se ha actualizado:
23 abr 2017 año
Los indicadores de los cambios de valor en los últimos años
Mínimo:
0.822
1 ene 1994 año
Máximo:
19.552
1 ene 1996 año
A la fecha de observación
Valor
Cambio absoluto
El cambio con respecto al valor anterior
1 ene 1963 año
5.9
+5.9
0.0%
1 ene 1964 año
6.59
+0.69
11.69%
1 ene 1965 año
6.095
-0.495
-7.52%
1 ene 1966 año
5.737
-0.357
-5.86%
1 ene 1967 año
6.039
+0.302
5.26%
1 ene 1968 año
5.982
-0.057
-0.94%
1 ene 1969 año
2.964
-3.018
-50.45%
1 ene 1971 año
2.033
-0.932
-31.43%
1 ene 1972 año
2.485
+0.452
22.24%
1 ene 1973 año
2.627
+0.142
5.73%
1 ene 1974 año
2.791
+0.164
6.25%
1 ene 1975 año
8.605
+5.814
208.27%
1 ene 1976 año
7.865
-0.74
-8.6%
1 ene 1977 año
9.027
+1.162
14.78%
1 ene 1978 año
1.453
-7.574
-83.9%
1 ene 1979 año
8.011
+6.558
451.2%
1 ene 1980 año
6.462
-1.549
-19.34%
1 ene 1981 año
13.85
+7.389
114.34%
1 ene 1984 año
2.303
-11.547
-83.37%
1 ene 1985 año
3.759
+1.456
63.21%
1 ene 1986 año
3.102
-0.657
-17.48%
1 ene 1987 año
1.718
-1.384
-44.62%
1 ene 1994 año
0.822
-0.896
-52.14%
1 ene 1995 año
1.247
+0.425
51.64%
1 ene 1996 año
19.552
+18.306
1.47 mil%
1 ene 2008 año
4.266
-15.287
-78.18%
1 ene 2009 año
5.446
+1.18
27.67%
1 ene 2010 año
2.473
-2.973
-54.58%
1 ene 2011 año
5.69
+3.217
130.05%
1 ene 2012 año
2.162
-3.528
-62.01%
1 ene 2013 año
1.103
-1.059
-48.97%
1 ene 2014 año
1.602
+0.499
45.26%
1 ene 2015 año
2.965
+1.363
85.05%
Ranking de los países por los datos estadísticos actuales


Comentarios: