29
/es/
es
AIzaSyAYiBZKx7MnpbEhh9jyipgxe19OcubqV5w
April 1, 2024
268672
Tunisia
TUN
true
2
1
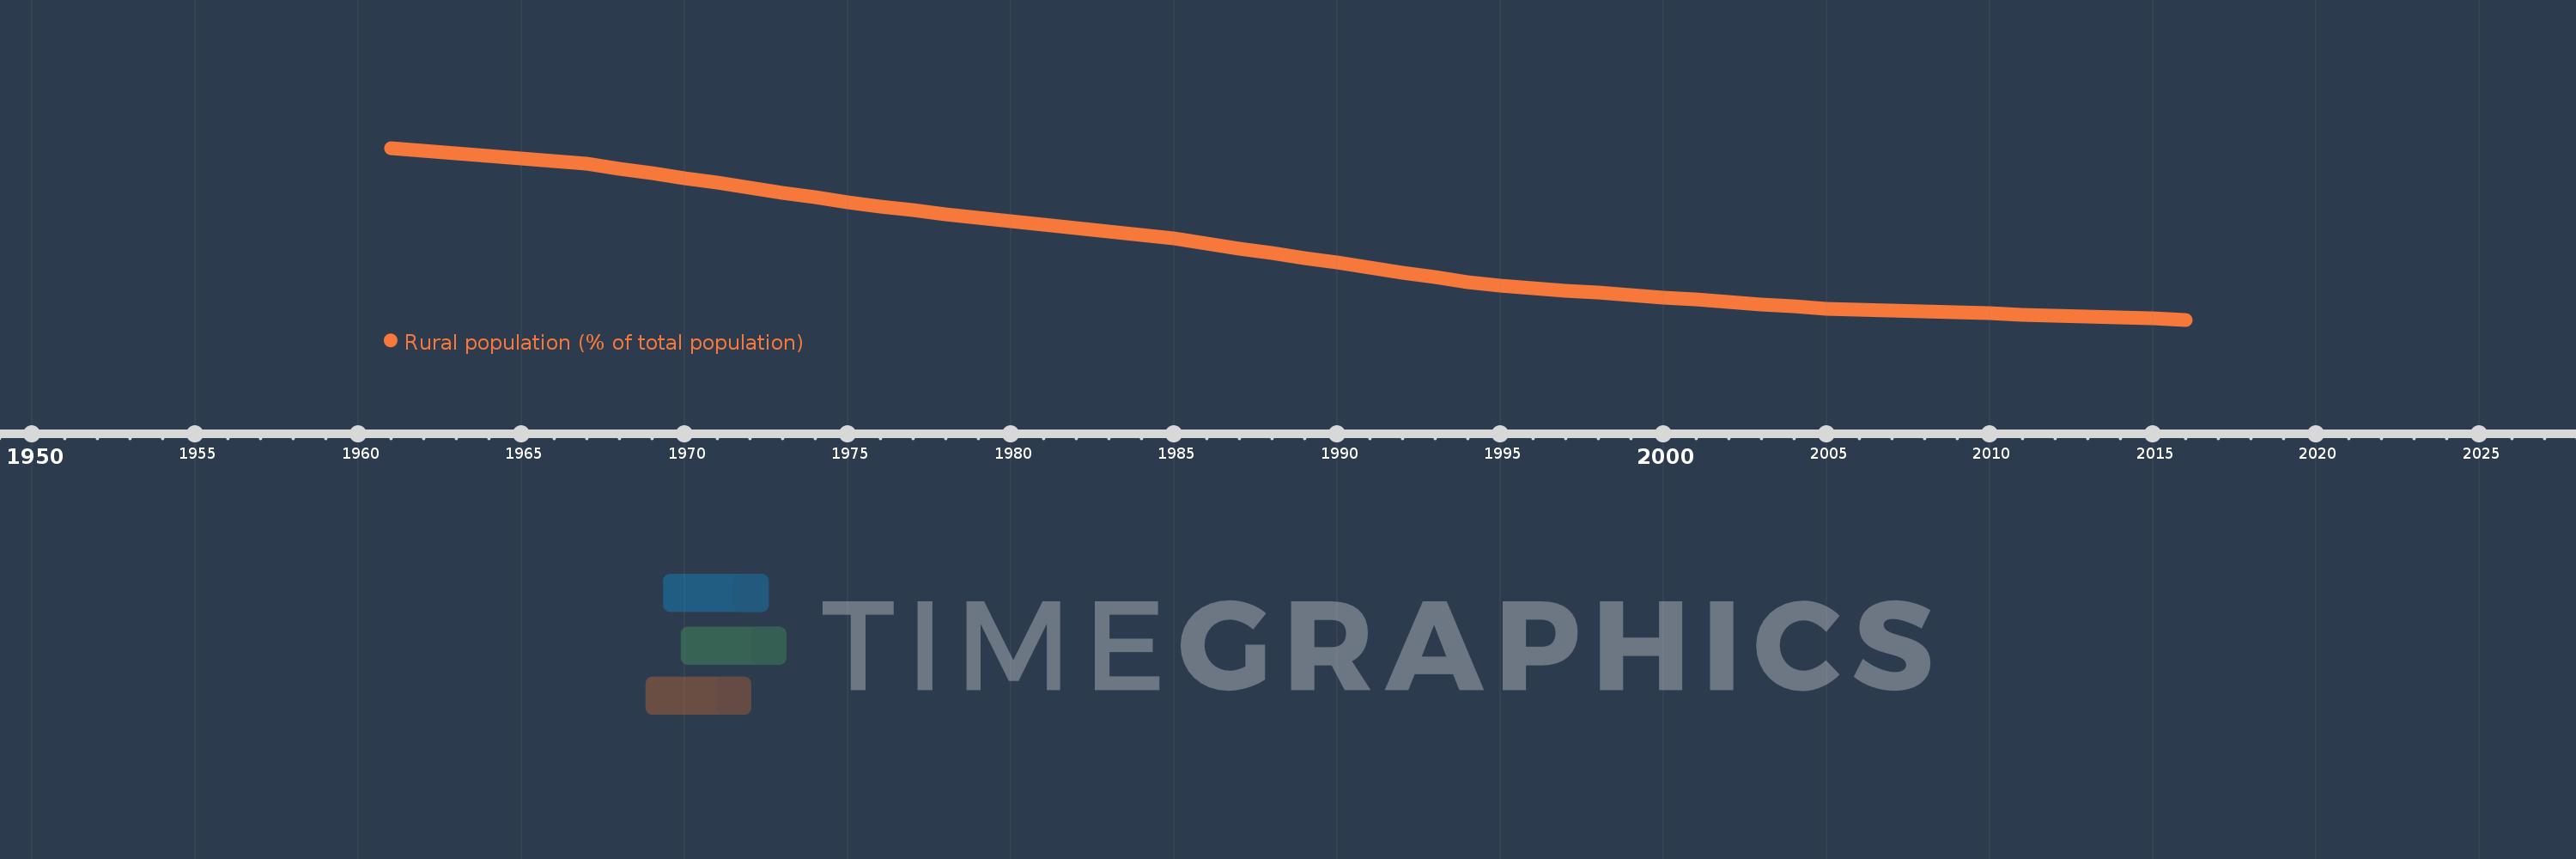
Rural population (% of total population)
2016,2015,2014,2013,2012,2011,2010,2009,2008,2007,2006,2005,2004,2003,2002,2001,2000,1999,1998,1997,1996,1995,1994,1993,1992,1991,1990,1989,1988,1987,1986,1985,1984,1983,1982,1981,1980,1979,1978,1977,1976,1975,1974,1973,1972,1971,1970,1969,1968,1967,1966,1965,1964,1963,1962,1961
Estas estadísticas en otros países:
AfghanistanAlbaniaAlgeriaAmerican SamoaAndorraAngolaAntigua and BarbudaArab WorldArgentinaArmeniaArubaAustraliaAustriaAzerbaijanBahamas, TheBahrainBangladeshBarbadosBelarusBelgiumBelizeBeninBermudaBhutanBoliviaBosnia and HerzegovinaBotswanaBrazilBritish Virgin IslandsBrunei DarussalamBulgariaBurkina FasoBurundiCabo VerdeCambodiaCameroonCanadaCaribbean small statesCayman IslandsCentral African RepublicCentral Europe and the BalticsChadChannel IslandsChileChinaColombiaComorosCongo, Dem. Rep.Congo, Rep.Costa RicaCote d'IvoireCroatiaCubaCuracaoCyprusCzech RepublicDenmarkDjiboutiDominicaDominican RepublicEarly-demographic dividendEast Asia & PacificEast Asia & Pacific (excluding high income)East Asia & Pacific (IDA & IBRD countries)EcuadorEgypt, Arab Rep.El SalvadorEquatorial GuineaEritreaEstoniaEthiopiaEuro areaEurope & Central AsiaEurope & Central Asia (excluding high income)Europe & Central Asia (IDA & IBRD countries)European UnionFaroe IslandsFijiFinlandFragile and conflict affected situationsFranceFrench PolynesiaGabonGambia, TheGeorgiaGermanyGhanaGibraltarGreeceGreenlandGrenadaGuamGuatemalaGuineaGuinea-BissauGuyanaHaitiHeavily indebted poor countries (HIPC)High incomeHondurasHong Kong SAR, ChinaHungaryIBRD onlyIcelandIDA & IBRD totalIDA blendIDA onlyIDA totalIndiaIndonesiaIran, Islamic Rep.IraqIrelandIsle of ManIsraelItalyJamaicaJapanJordanKazakhstanKenyaKiribatiKorea, Dem. People’s Rep.Korea, Rep.KuwaitKyrgyz RepublicLao PDRLate-demographic dividendLatin America & Caribbean Latin America & Caribbean (excluding high income)Latin America & the Caribbean (IDA & IBRD countries)LatviaLeast developed countries: UN classificationLebanonLesothoLiberiaLibyaLiechtensteinLithuaniaLow & middle incomeLow incomeLower middle incomeLuxembourgMacao SAR, ChinaMacedonia, FYRMadagascarMalawiMalaysiaMaldivesMaliMaltaMarshall IslandsMauritaniaMauritiusMexicoMicronesia, Fed. Sts.Middle East & North AfricaMiddle East & North Africa (excluding high income)Middle East & North Africa (IDA & IBRD countries)Middle incomeMoldovaMonacoMongoliaMontenegroMoroccoMozambiqueMyanmarNamibiaNauruNepalNetherlandsNew CaledoniaNew ZealandNicaraguaNigerNigeriaNorth AmericaNorthern Mariana IslandsNorwayOECD membersOmanOther small statesPacific island small statesPakistanPalauPanamaPapua New GuineaParaguayPeruPhilippinesPolandPortugalPost-demographic dividendPre-demographic dividendPuerto RicoQatarRomaniaRussian FederationRwandaSamoaSan MarinoSao Tome and PrincipeSaudi ArabiaSenegalSerbiaSeychellesSierra LeoneSingaporeSint Maarten (Dutch part)Slovak RepublicSloveniaSmall statesSolomon IslandsSomaliaSouth AfricaSouth AsiaSouth Asia (IDA & IBRD)South SudanSpainSri LankaSt. Kitts and NevisSt. LuciaSt. Vincent and the GrenadinesSub-Saharan Africa Sub-Saharan Africa (excluding high income)Sub-Saharan Africa (IDA & IBRD countries)SudanSurinameSwazilandSwedenSwitzerlandSyrian Arab RepublicTajikistanTanzaniaThailandTimor-LesteTogoTongaTrinidad and TobagoTunisiaTurkeyTurkmenistanTurks and Caicos IslandsTuvaluUgandaUkraineUnited Arab EmiratesUnited KingdomUnited StatesUpper middle incomeUruguayUzbekistanVanuatuVenezuela, RBVietnamVirgin Islands (U.S.)West Bank and GazaWorldYemen, Rep.ZambiaZimbabwe línea de tiempo (timeline):
En esta escala de tiempo se presenta un gráfico de 1961 y 2016 de Tunisia. Los datos de 1960 están ausentes. El número de observaciones reales por fecha: 56.
Fuente (nombre):
Indicadores del desarrollo mundial
Fuente (organización):
World Bank Staff estimates based on United Nations, World Urbanization Prospects.
Categorías:
Agriculture & Rural Development
Se ha actualizado:
23 abr 2017 año
Los indicadores de los cambios de valor en los últimos años
Mínimo:
33.158
1 ene 2016 año
Máximo:
62.489
1 ene 1961 año
A la fecha de observación
Valor
Cambio absoluto
El cambio con respecto al valor anterior
1 ene 1961 año
62.489
+62.489
0.0%
1 ene 1962 año
62.05
-0.439
-0.7%
1 ene 1963 año
61.609
-0.441
-0.71%
1 ene 1964 año
61.167
-0.442
-0.72%
1 ene 1965 año
60.721
-0.446
-0.73%
1 ene 1966 año
60.276
-0.445
-0.73%
1 ene 1967 año
59.77
-0.506
-0.84%
1 ene 1968 año
58.964
-0.806
-1.35%
1 ene 1969 año
58.152
-0.812
-1.38%
1 ene 1970 año
57.338
-0.814
-1.4%
1 ene 1971 año
56.518
-0.82
-1.43%
1 ene 1972 año
55.695
-0.823
-1.46%
1 ene 1973 año
54.868
-0.827
-1.48%
1 ene 1974 año
54.041
-0.827
-1.51%
1 ene 1975 año
53.21
-0.831
-1.54%
1 ene 1976 año
52.412
-0.798
-1.5%
1 ene 1977 año
51.816
-0.596
-1.14%
1 ene 1978 año
51.221
-0.595
-1.15%
1 ene 1979 año
50.625
-0.596
-1.16%
1 ene 1980 año
50.028
-0.597
-1.18%
1 ene 1981 año
49.431
-0.597
-1.19%
1 ene 1982 año
48.836
-0.595
-1.2%
1 ene 1983 año
48.24
-0.596
-1.22%
1 ene 1984 año
47.644
-0.596
-1.24%
1 ene 1985 año
46.989
-0.655
-1.37%
1 ene 1986 año
46.161
-0.828
-1.76%
1 ene 1987 año
45.333
-0.828
-1.79%
1 ene 1988 año
44.509
-0.824
-1.82%
1 ene 1989 año
43.686
-0.823
-1.85%
1 ene 1990 año
42.869
-0.817
-1.87%
1 ene 1991 año
42.054
-0.815
-1.9%
1 ene 1992 año
41.244
-0.81
-1.93%
1 ene 1993 año
40.438
-0.806
-1.95%
1 ene 1994 año
39.638
-0.8
-1.98%
1 ene 1995 año
38.922
-0.716
-1.81%
1 ene 1996 año
38.526
-0.396
-1.02%
1 ene 1997 año
38.13
-0.396
-1.03%
1 ene 1998 año
37.738
-0.392
-1.03%
1 ene 1999 año
37.347
-0.391
-1.04%
1 ene 2000 año
36.957
-0.39
-1.04%
1 ene 2001 año
36.568
-0.389
-1.05%
1 ene 2002 año
36.182
-0.386
-1.06%
1 ene 2003 año
35.798
-0.384
-1.06%
1 ene 2004 año
35.415
-0.383
-1.07%
1 ene 2005 año
35.071
-0.344
-0.97%
1 ene 2006 año
34.902
-0.169
-0.48%
1 ene 2007 año
34.734
-0.168
-0.48%
1 ene 2008 año
34.567
-0.167
-0.48%
1 ene 2009 año
34.399
-0.168
-0.49%
1 ene 2010 año
34.233
-0.166
-0.48%
1 ene 2011 año
34.066
-0.167
-0.49%
1 ene 2012 año
33.9
-0.166
-0.49%
1 ene 2013 año
33.726
-0.174
-0.51%
1 ene 2014 año
33.544
-0.182
-0.54%
1 ene 2015 año
33.355
-0.189
-0.56%
1 ene 2016 año
33.158
-0.197
-0.59%
Ranking de los países por los datos estadísticos actuales


Comentarios: