29
/es/
es
AIzaSyAYiBZKx7MnpbEhh9jyipgxe19OcubqV5w
April 1, 2024
125495
Egypt, Arab Rep.
EGY
true
2
1
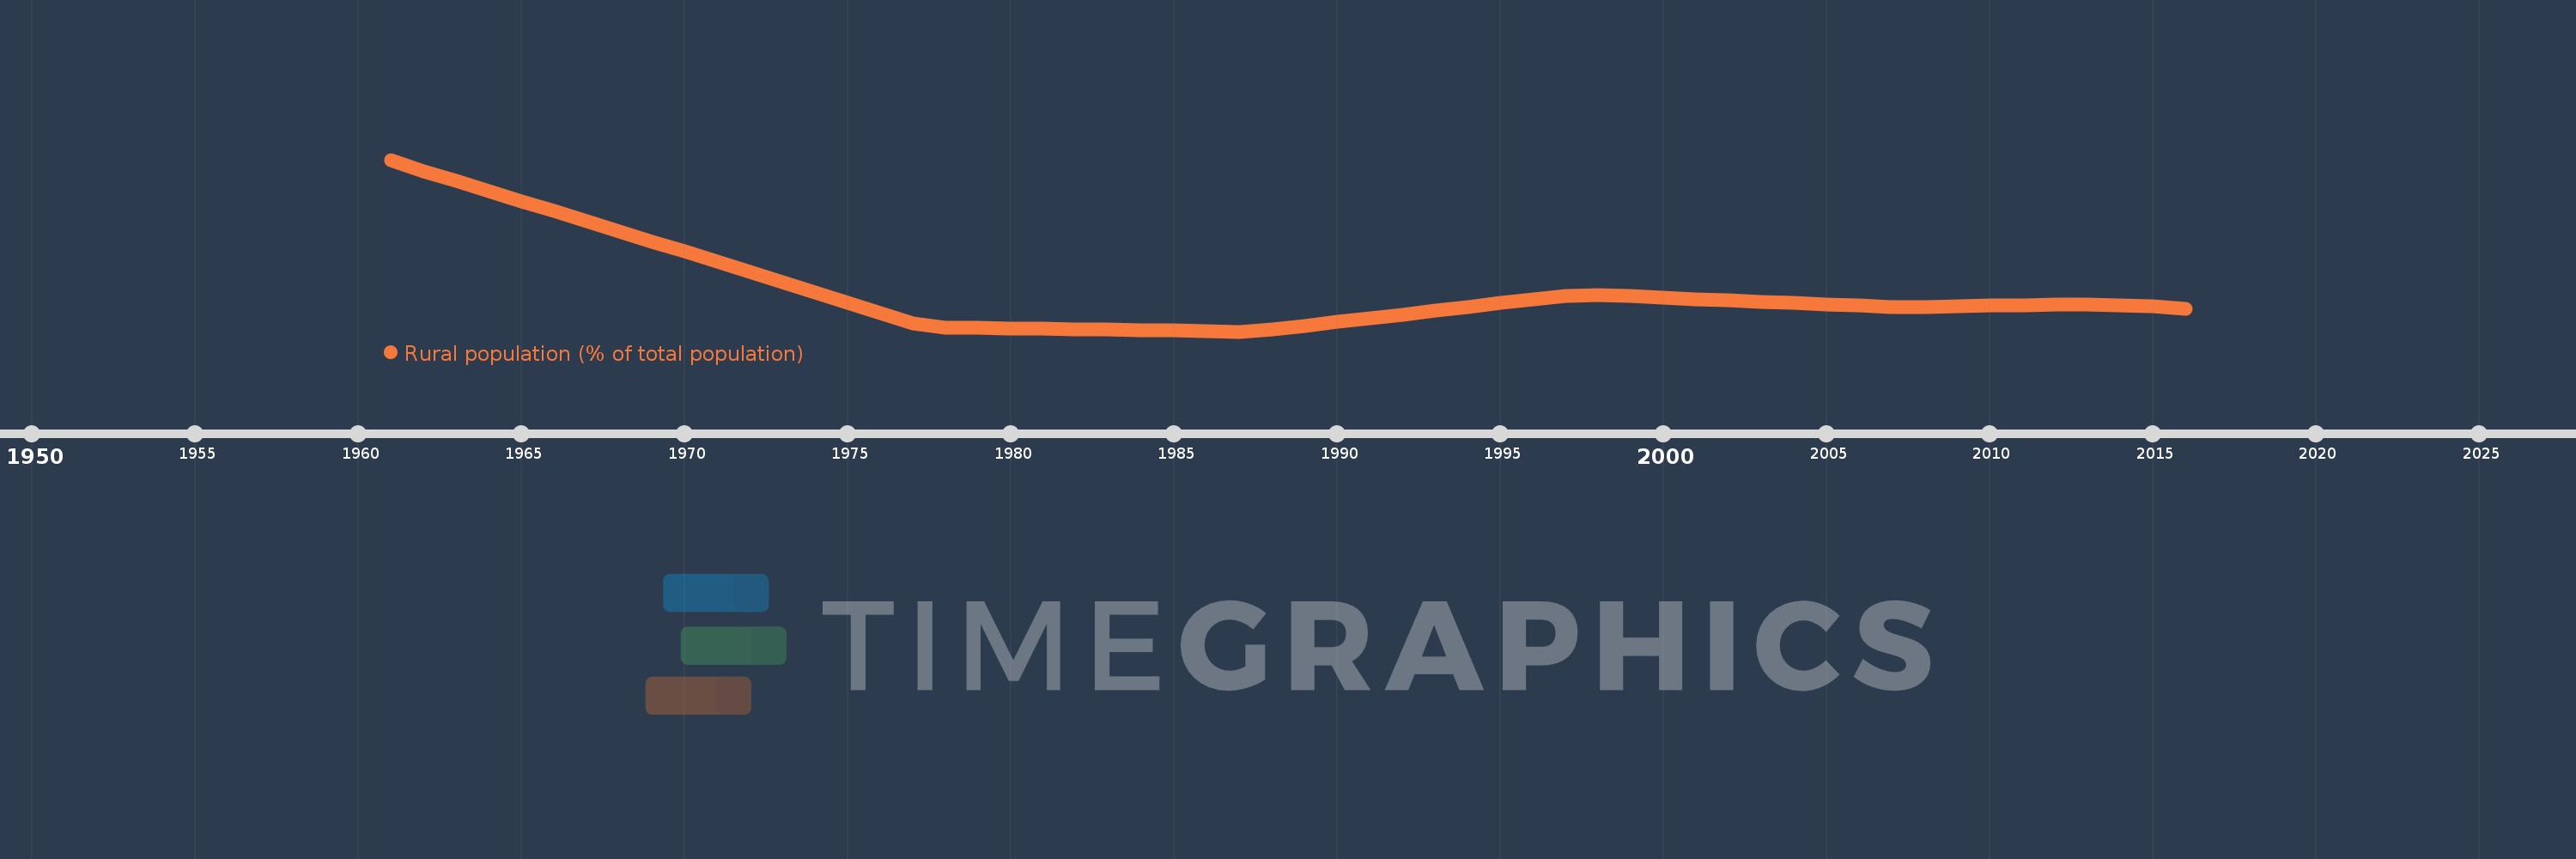
Rural population (% of total population)
2016,2015,2014,2013,2012,2011,2010,2009,2008,2007,2006,2005,2004,2003,2002,2001,2000,1999,1998,1997,1996,1995,1994,1993,1992,1991,1990,1989,1988,1987,1986,1985,1984,1983,1982,1981,1980,1979,1978,1977,1976,1975,1974,1973,1972,1971,1970,1969,1968,1967,1966,1965,1964,1963,1962,1961
Estas estadísticas en otros países:
AfghanistanAlbaniaAlgeriaAmerican SamoaAndorraAngolaAntigua and BarbudaArab WorldArgentinaArmeniaArubaAustraliaAustriaAzerbaijanBahamas, TheBahrainBangladeshBarbadosBelarusBelgiumBelizeBeninBermudaBhutanBoliviaBosnia and HerzegovinaBotswanaBrazilBritish Virgin IslandsBrunei DarussalamBulgariaBurkina FasoBurundiCabo VerdeCambodiaCameroonCanadaCaribbean small statesCayman IslandsCentral African RepublicCentral Europe and the BalticsChadChannel IslandsChileChinaColombiaComorosCongo, Dem. Rep.Congo, Rep.Costa RicaCote d'IvoireCroatiaCubaCuracaoCyprusCzech RepublicDenmarkDjiboutiDominicaDominican RepublicEarly-demographic dividendEast Asia & PacificEast Asia & Pacific (excluding high income)East Asia & Pacific (IDA & IBRD countries)EcuadorEgypt, Arab Rep.El SalvadorEquatorial GuineaEritreaEstoniaEthiopiaEuro areaEurope & Central AsiaEurope & Central Asia (excluding high income)Europe & Central Asia (IDA & IBRD countries)European UnionFaroe IslandsFijiFinlandFragile and conflict affected situationsFranceFrench PolynesiaGabonGambia, TheGeorgiaGermanyGhanaGibraltarGreeceGreenlandGrenadaGuamGuatemalaGuineaGuinea-BissauGuyanaHaitiHeavily indebted poor countries (HIPC)High incomeHondurasHong Kong SAR, ChinaHungaryIBRD onlyIcelandIDA & IBRD totalIDA blendIDA onlyIDA totalIndiaIndonesiaIran, Islamic Rep.IraqIrelandIsle of ManIsraelItalyJamaicaJapanJordanKazakhstanKenyaKiribatiKorea, Dem. People’s Rep.Korea, Rep.KuwaitKyrgyz RepublicLao PDRLate-demographic dividendLatin America & Caribbean Latin America & Caribbean (excluding high income)Latin America & the Caribbean (IDA & IBRD countries)LatviaLeast developed countries: UN classificationLebanonLesothoLiberiaLibyaLiechtensteinLithuaniaLow & middle incomeLow incomeLower middle incomeLuxembourgMacao SAR, ChinaMacedonia, FYRMadagascarMalawiMalaysiaMaldivesMaliMaltaMarshall IslandsMauritaniaMauritiusMexicoMicronesia, Fed. Sts.Middle East & North AfricaMiddle East & North Africa (excluding high income)Middle East & North Africa (IDA & IBRD countries)Middle incomeMoldovaMonacoMongoliaMontenegroMoroccoMozambiqueMyanmarNamibiaNauruNepalNetherlandsNew CaledoniaNew ZealandNicaraguaNigerNigeriaNorth AmericaNorthern Mariana IslandsNorwayOECD membersOmanOther small statesPacific island small statesPakistanPalauPanamaPapua New GuineaParaguayPeruPhilippinesPolandPortugalPost-demographic dividendPre-demographic dividendPuerto RicoQatarRomaniaRussian FederationRwandaSamoaSan MarinoSao Tome and PrincipeSaudi ArabiaSenegalSerbiaSeychellesSierra LeoneSingaporeSint Maarten (Dutch part)Slovak RepublicSloveniaSmall statesSolomon IslandsSomaliaSouth AfricaSouth AsiaSouth Asia (IDA & IBRD)South SudanSpainSri LankaSt. Kitts and NevisSt. LuciaSt. Vincent and the GrenadinesSub-Saharan Africa Sub-Saharan Africa (excluding high income)Sub-Saharan Africa (IDA & IBRD countries)SudanSurinameSwazilandSwedenSwitzerlandSyrian Arab RepublicTajikistanTanzaniaThailandTimor-LesteTogoTongaTrinidad and TobagoTunisiaTurkeyTurkmenistanTurks and Caicos IslandsTuvaluUgandaUkraineUnited Arab EmiratesUnited KingdomUnited StatesUpper middle incomeUruguayUzbekistanVanuatuVenezuela, RBVietnamVirgin Islands (U.S.)West Bank and GazaWorldYemen, Rep.ZambiaZimbabwe línea de tiempo (timeline):
En esta escala de tiempo se presenta un gráfico de 1961 y 2016 de Egypt, Arab Rep.. Los datos de 1960 están ausentes. El número de observaciones reales por fecha: 56.
Fuente (nombre):
Indicadores del desarrollo mundial
Fuente (organización):
World Bank Staff estimates based on United Nations, World Urbanization Prospects.
Categorías:
Agriculture & Rural Development
Se ha actualizado:
23 abr 2017 año
Los indicadores de los cambios de valor en los últimos años
Mínimo:
56.046
1 ene 1987 año
Máximo:
62.136
1 ene 1961 año
A la fecha de observación
Valor
Cambio absoluto
El cambio con respecto al valor anterior
1 ene 1961 año
62.136
+62.136
0.0%
1 ene 1962 año
61.728
-0.408
-0.66%
1 ene 1963 año
61.376
-0.352
-0.57%
1 ene 1964 año
61.023
-0.353
-0.58%
1 ene 1965 año
60.669
-0.354
-0.58%
1 ene 1966 año
60.314
-0.355
-0.59%
1 ene 1967 año
59.958
-0.356
-0.59%
1 ene 1968 año
59.601
-0.357
-0.6%
1 ene 1969 año
59.242
-0.359
-0.6%
1 ene 1970 año
58.883
-0.359
-0.61%
1 ene 1971 año
58.523
-0.36
-0.61%
1 ene 1972 año
58.162
-0.361
-0.62%
1 ene 1973 año
57.8
-0.362
-0.62%
1 ene 1974 año
57.437
-0.363
-0.63%
1 ene 1975 año
57.074
-0.363
-0.63%
1 ene 1976 año
56.709
-0.365
-0.64%
1 ene 1977 año
56.344
-0.365
-0.64%
1 ene 1978 año
56.19
-0.154
-0.27%
1 ene 1979 año
56.174
-0.016
-0.03%
1 ene 1980 año
56.158
-0.016
-0.03%
1 ene 1981 año
56.142
-0.016
-0.03%
1 ene 1982 año
56.126
-0.016
-0.03%
1 ene 1983 año
56.11
-0.016
-0.03%
1 ene 1984 año
56.094
-0.016
-0.03%
1 ene 1985 año
56.078
-0.016
-0.03%
1 ene 1986 año
56.062
-0.016
-0.03%
1 ene 1987 año
56.046
-0.016
-0.03%
1 ene 1988 año
56.123
+0.077
0.14%
1 ene 1989 año
56.256
+0.133
0.24%
1 ene 1990 año
56.389
+0.133
0.24%
1 ene 1991 año
56.522
+0.133
0.24%
1 ene 1992 año
56.655
+0.133
0.24%
1 ene 1993 año
56.788
+0.133
0.23%
1 ene 1994 año
56.921
+0.133
0.23%
1 ene 1995 año
57.054
+0.133
0.23%
1 ene 1996 año
57.186
+0.132
0.23%
1 ene 1997 año
57.319
+0.133
0.23%
1 ene 1998 año
57.342
+0.023
0.04%
1 ene 1999 año
57.296
-0.046
-0.08%
1 ene 2000 año
57.25
-0.046
-0.08%
1 ene 2001 año
57.203
-0.047
-0.08%
1 ene 2002 año
57.157
-0.046
-0.08%
1 ene 2003 año
57.111
-0.046
-0.08%
1 ene 2004 año
57.065
-0.046
-0.08%
1 ene 2005 año
57.019
-0.046
-0.08%
1 ene 2006 año
56.973
-0.046
-0.08%
1 ene 2007 año
56.927
-0.046
-0.08%
1 ene 2008 año
56.922
-0.005
-0.01%
1 ene 2009 año
56.942
+0.02
0.04%
1 ene 2010 año
56.961
+0.019
0.03%
1 ene 2011 año
56.981
+0.02
0.04%
1 ene 2012 año
57.0
+0.019
0.03%
1 ene 2013 año
56.998
-0.002
0.0%
1 ene 2014 año
56.975
-0.023
-0.04%
1 ene 2015 año
56.931
-0.044
-0.08%
1 ene 2016 año
56.865
-0.066
-0.12%
Ranking de los países por los datos estadísticos actuales


Comentarios: