29
/es/
es
AIzaSyAYiBZKx7MnpbEhh9jyipgxe19OcubqV5w
April 1, 2024
163240
Jamaica
JAM
true
2
1
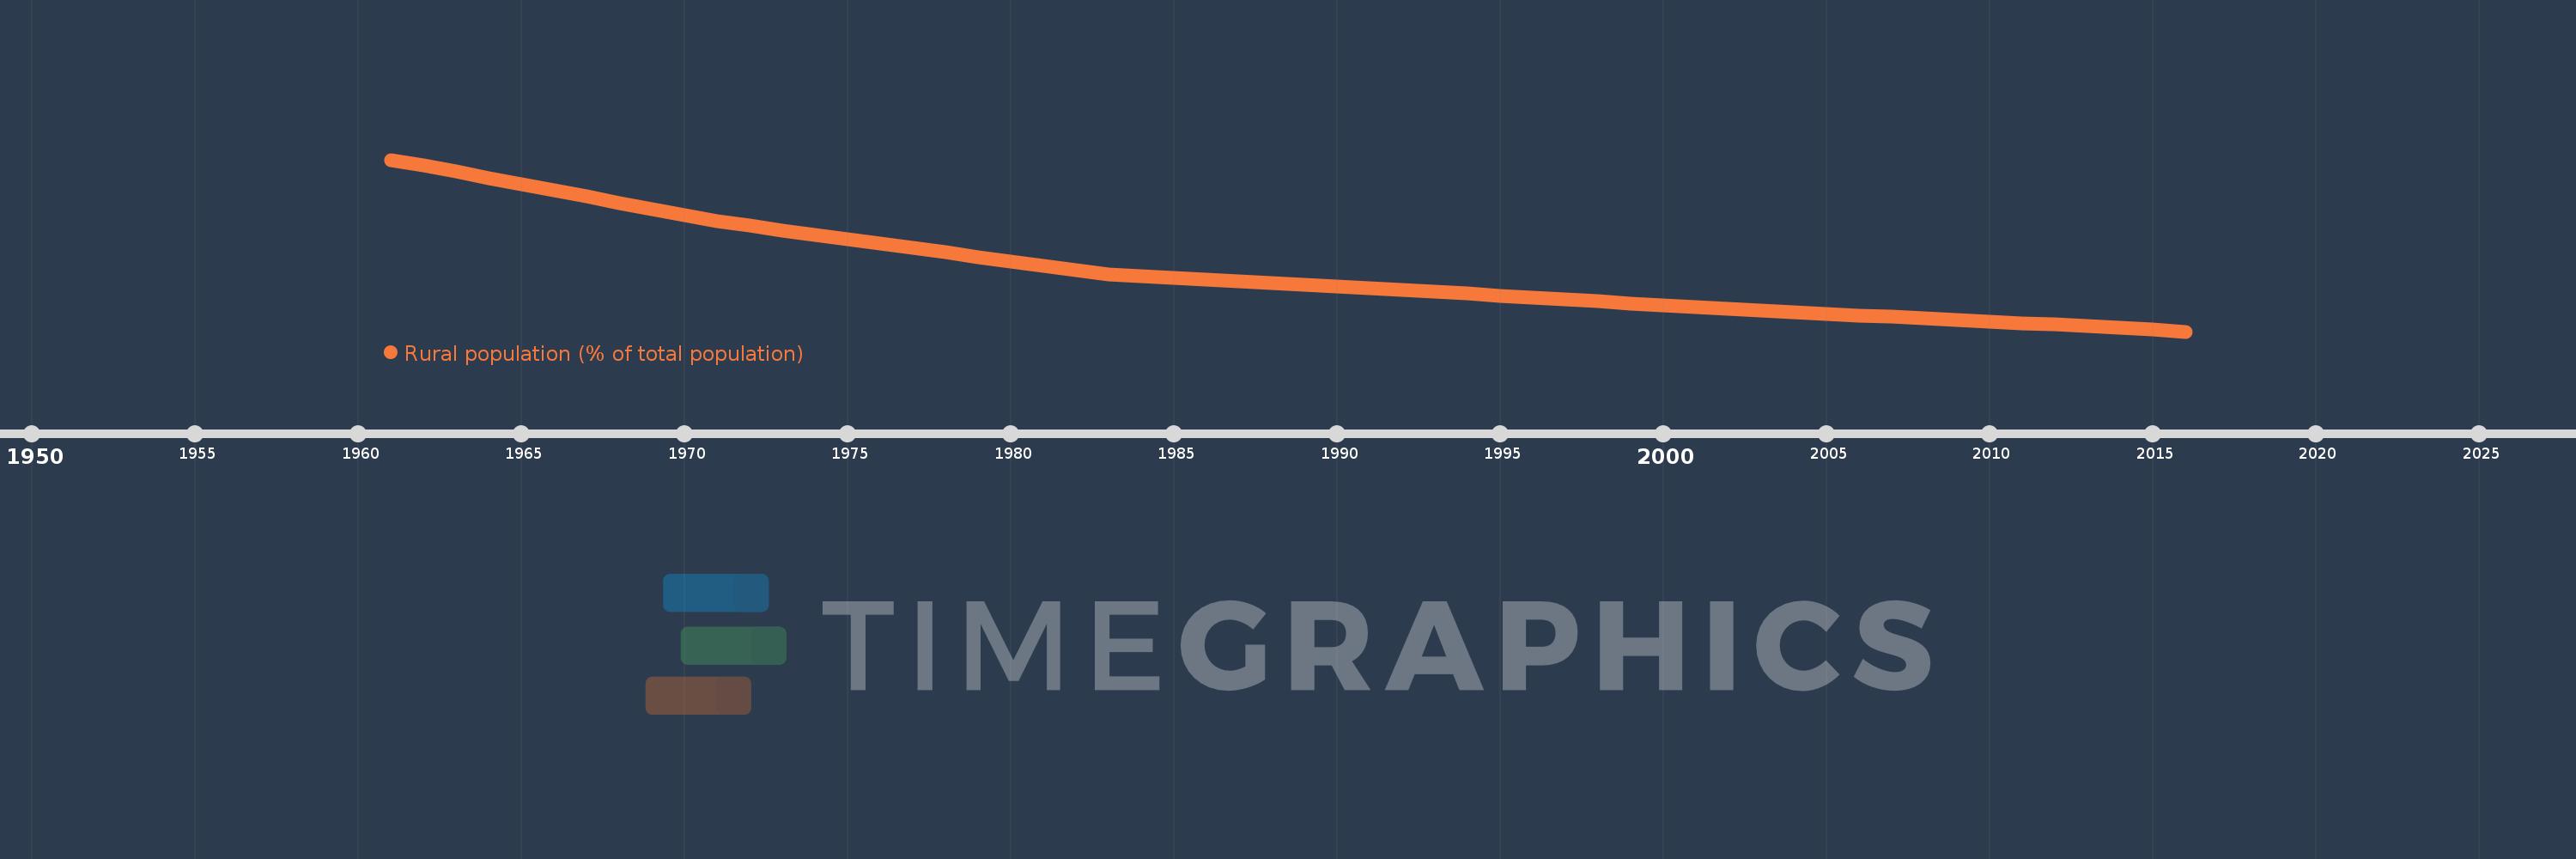
Rural population (% of total population)
2016,2015,2014,2013,2012,2011,2010,2009,2008,2007,2006,2005,2004,2003,2002,2001,2000,1999,1998,1997,1996,1995,1994,1993,1992,1991,1990,1989,1988,1987,1986,1985,1984,1983,1982,1981,1980,1979,1978,1977,1976,1975,1974,1973,1972,1971,1970,1969,1968,1967,1966,1965,1964,1963,1962,1961
Estas estadísticas en otros países:
AfghanistanAlbaniaAlgeriaAmerican SamoaAndorraAngolaAntigua and BarbudaArab WorldArgentinaArmeniaArubaAustraliaAustriaAzerbaijanBahamas, TheBahrainBangladeshBarbadosBelarusBelgiumBelizeBeninBermudaBhutanBoliviaBosnia and HerzegovinaBotswanaBrazilBritish Virgin IslandsBrunei DarussalamBulgariaBurkina FasoBurundiCabo VerdeCambodiaCameroonCanadaCaribbean small statesCayman IslandsCentral African RepublicCentral Europe and the BalticsChadChannel IslandsChileChinaColombiaComorosCongo, Dem. Rep.Congo, Rep.Costa RicaCote d'IvoireCroatiaCubaCuracaoCyprusCzech RepublicDenmarkDjiboutiDominicaDominican RepublicEarly-demographic dividendEast Asia & PacificEast Asia & Pacific (excluding high income)East Asia & Pacific (IDA & IBRD countries)EcuadorEgypt, Arab Rep.El SalvadorEquatorial GuineaEritreaEstoniaEthiopiaEuro areaEurope & Central AsiaEurope & Central Asia (excluding high income)Europe & Central Asia (IDA & IBRD countries)European UnionFaroe IslandsFijiFinlandFragile and conflict affected situationsFranceFrench PolynesiaGabonGambia, TheGeorgiaGermanyGhanaGibraltarGreeceGreenlandGrenadaGuamGuatemalaGuineaGuinea-BissauGuyanaHaitiHeavily indebted poor countries (HIPC)High incomeHondurasHong Kong SAR, ChinaHungaryIBRD onlyIcelandIDA & IBRD totalIDA blendIDA onlyIDA totalIndiaIndonesiaIran, Islamic Rep.IraqIrelandIsle of ManIsraelItalyJamaicaJapanJordanKazakhstanKenyaKiribatiKorea, Dem. People’s Rep.Korea, Rep.KuwaitKyrgyz RepublicLao PDRLate-demographic dividendLatin America & Caribbean Latin America & Caribbean (excluding high income)Latin America & the Caribbean (IDA & IBRD countries)LatviaLeast developed countries: UN classificationLebanonLesothoLiberiaLibyaLiechtensteinLithuaniaLow & middle incomeLow incomeLower middle incomeLuxembourgMacao SAR, ChinaMacedonia, FYRMadagascarMalawiMalaysiaMaldivesMaliMaltaMarshall IslandsMauritaniaMauritiusMexicoMicronesia, Fed. Sts.Middle East & North AfricaMiddle East & North Africa (excluding high income)Middle East & North Africa (IDA & IBRD countries)Middle incomeMoldovaMonacoMongoliaMontenegroMoroccoMozambiqueMyanmarNamibiaNauruNepalNetherlandsNew CaledoniaNew ZealandNicaraguaNigerNigeriaNorth AmericaNorthern Mariana IslandsNorwayOECD membersOmanOther small statesPacific island small statesPakistanPalauPanamaPapua New GuineaParaguayPeruPhilippinesPolandPortugalPost-demographic dividendPre-demographic dividendPuerto RicoQatarRomaniaRussian FederationRwandaSamoaSan MarinoSao Tome and PrincipeSaudi ArabiaSenegalSerbiaSeychellesSierra LeoneSingaporeSint Maarten (Dutch part)Slovak RepublicSloveniaSmall statesSolomon IslandsSomaliaSouth AfricaSouth AsiaSouth Asia (IDA & IBRD)South SudanSpainSri LankaSt. Kitts and NevisSt. LuciaSt. Vincent and the GrenadinesSub-Saharan Africa Sub-Saharan Africa (excluding high income)Sub-Saharan Africa (IDA & IBRD countries)SudanSurinameSwazilandSwedenSwitzerlandSyrian Arab RepublicTajikistanTanzaniaThailandTimor-LesteTogoTongaTrinidad and TobagoTunisiaTurkeyTurkmenistanTurks and Caicos IslandsTuvaluUgandaUkraineUnited Arab EmiratesUnited KingdomUnited StatesUpper middle incomeUruguayUzbekistanVanuatuVenezuela, RBVietnamVirgin Islands (U.S.)West Bank and GazaWorldYemen, Rep.ZambiaZimbabwe línea de tiempo (timeline):
En esta escala de tiempo se presenta un gráfico de 1961 y 2016 de Jamaica. Los datos de 1960 están ausentes. El número de observaciones reales por fecha: 56.
Fuente (nombre):
Indicadores del desarrollo mundial
Fuente (organización):
World Bank Staff estimates based on United Nations, World Urbanization Prospects.
Categorías:
Agriculture & Rural Development
Se ha actualizado:
23 abr 2017 año
Los indicadores de los cambios de valor en los últimos años
Mínimo:
45.212
1 ene 2016 año
Máximo:
66.231
1 ene 1961 año
A la fecha de observación
Valor
Cambio absoluto
El cambio con respecto al valor anterior
1 ene 1961 año
66.231
+66.231
0.0%
1 ene 1962 año
65.5
-0.731
-1.1%
1 ene 1963 año
64.761
-0.739
-1.13%
1 ene 1964 año
64.015
-0.746
-1.15%
1 ene 1965 año
63.26
-0.755
-1.18%
1 ene 1966 año
62.501
-0.759
-1.2%
1 ene 1967 año
61.735
-0.766
-1.23%
1 ene 1968 año
60.964
-0.771
-1.25%
1 ene 1969 año
60.185
-0.779
-1.28%
1 ene 1970 año
59.404
-0.781
-1.3%
1 ene 1971 año
58.676
-0.728
-1.23%
1 ene 1972 año
58.142
-0.534
-0.91%
1 ene 1973 año
57.605
-0.537
-0.92%
1 ene 1974 año
57.067
-0.538
-0.93%
1 ene 1975 año
56.528
-0.539
-0.94%
1 ene 1976 año
55.987
-0.541
-0.96%
1 ene 1977 año
55.443
-0.544
-0.97%
1 ene 1978 año
54.9
-0.543
-0.98%
1 ene 1979 año
54.355
-0.545
-0.99%
1 ene 1980 año
53.809
-0.546
-1.0%
1 ene 1981 año
53.261
-0.548
-1.02%
1 ene 1982 año
52.714
-0.547
-1.03%
1 ene 1983 año
52.187
-0.527
-1.0%
1 ene 1984 año
51.984
-0.203
-0.39%
1 ene 1985 año
51.78
-0.204
-0.39%
1 ene 1986 año
51.576
-0.204
-0.39%
1 ene 1987 año
51.372
-0.204
-0.4%
1 ene 1988 año
51.168
-0.204
-0.4%
1 ene 1989 año
50.964
-0.204
-0.4%
1 ene 1990 año
50.76
-0.204
-0.4%
1 ene 1991 año
50.556
-0.204
-0.4%
1 ene 1992 año
50.344
-0.212
-0.42%
1 ene 1993 año
50.104
-0.24
-0.48%
1 ene 1994 año
49.864
-0.24
-0.48%
1 ene 1995 año
49.625
-0.239
-0.48%
1 ene 1996 año
49.385
-0.24
-0.48%
1 ene 1997 año
49.145
-0.24
-0.49%
1 ene 1998 año
48.905
-0.24
-0.49%
1 ene 1999 año
48.665
-0.24
-0.49%
1 ene 2000 año
48.426
-0.239
-0.49%
1 ene 2001 año
48.186
-0.24
-0.5%
1 ene 2002 año
47.947
-0.239
-0.5%
1 ene 2003 año
47.749
-0.198
-0.41%
1 ene 2004 año
47.563
-0.186
-0.39%
1 ene 2005 año
47.375
-0.188
-0.4%
1 ene 2006 año
47.189
-0.186
-0.39%
1 ene 2007 año
47.002
-0.187
-0.4%
1 ene 2008 año
46.816
-0.186
-0.4%
1 ene 2009 año
46.629
-0.187
-0.4%
1 ene 2010 año
46.443
-0.186
-0.4%
1 ene 2011 año
46.257
-0.186
-0.4%
1 ene 2012 año
46.07
-0.187
-0.4%
1 ene 2013 año
45.873
-0.197
-0.43%
1 ene 2014 año
45.664
-0.209
-0.46%
1 ene 2015 año
45.444
-0.22
-0.48%
1 ene 2016 año
45.212
-0.232
-0.51%
Ranking de los países por los datos estadísticos actuales


Comentarios: