29
/es/
es
AIzaSyAYiBZKx7MnpbEhh9jyipgxe19OcubqV5w
April 1, 2024
138724
Georgia
GEO
true
2
1
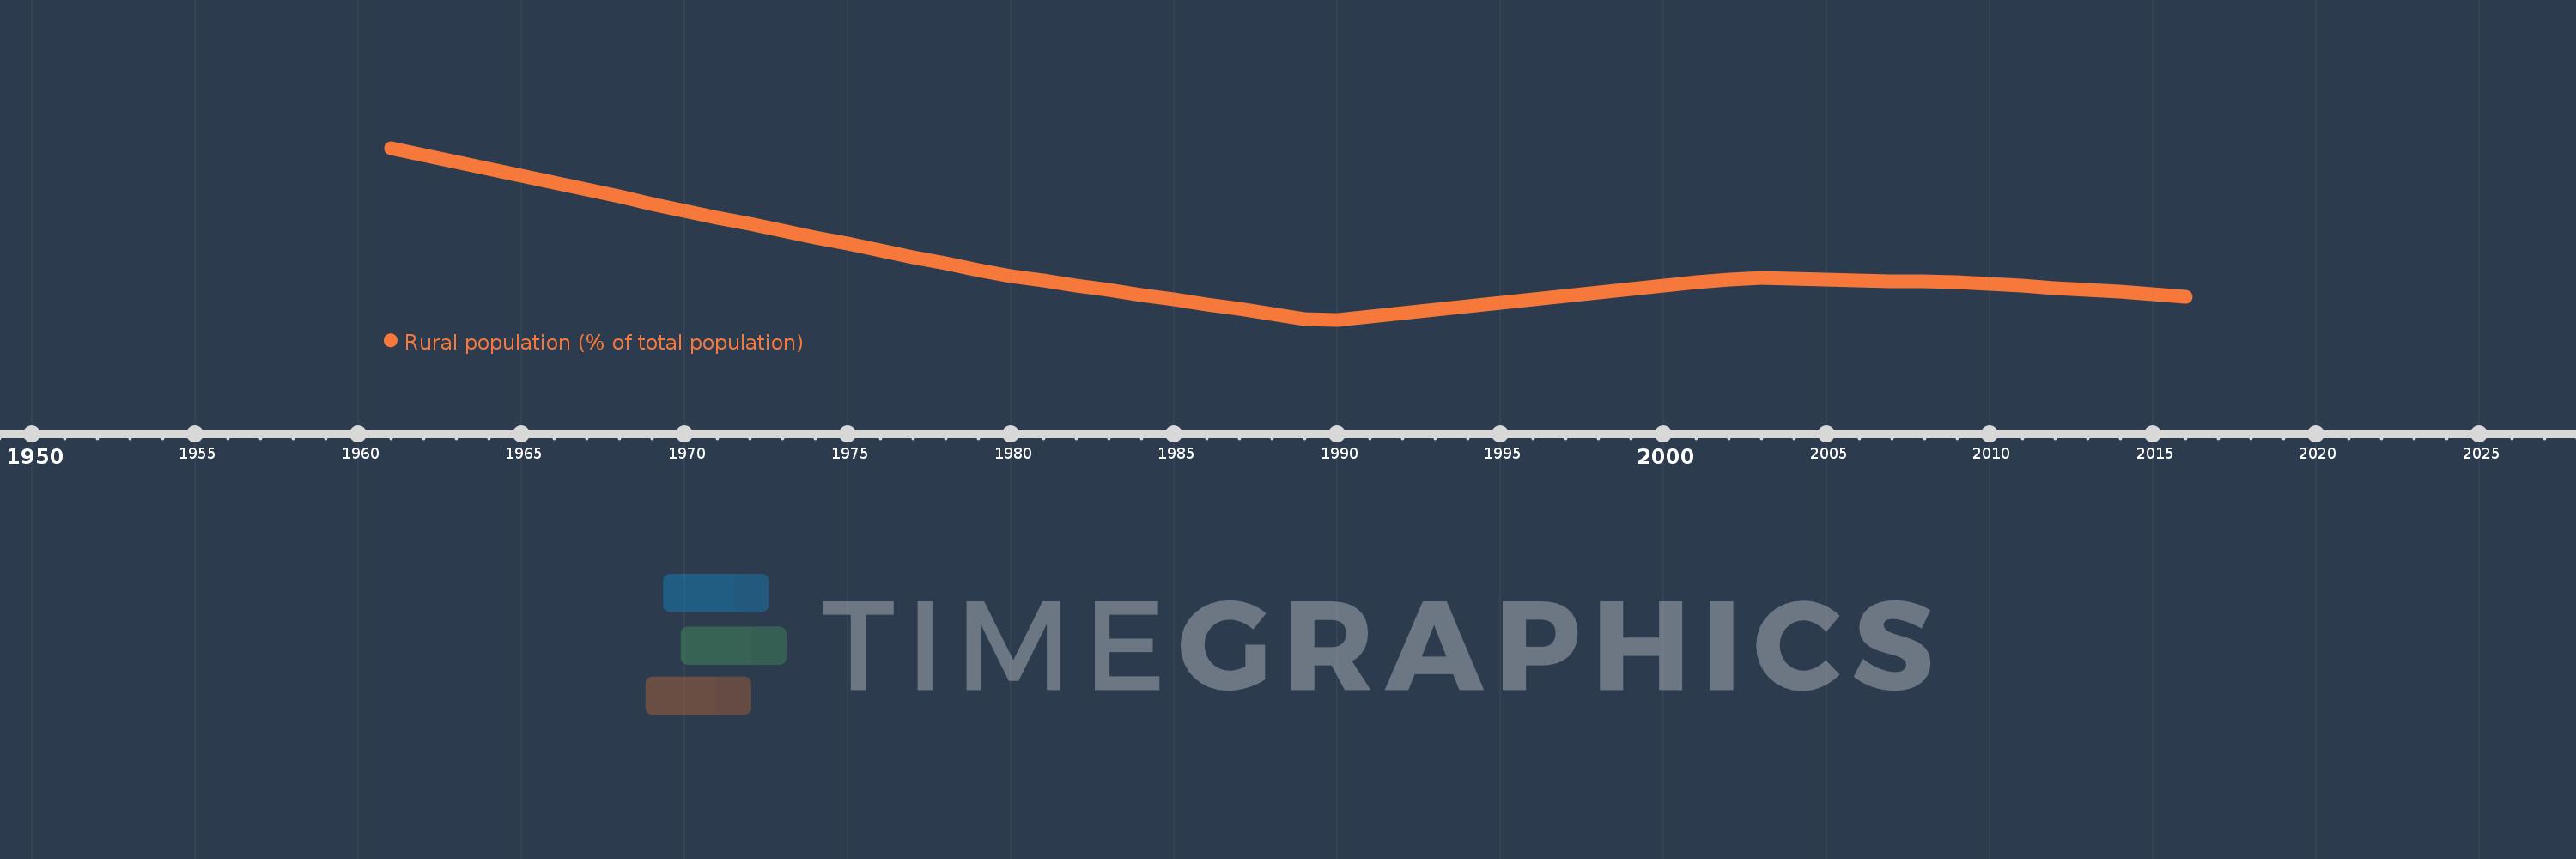
Rural population (% of total population)
2016,2015,2014,2013,2012,2011,2010,2009,2008,2007,2006,2005,2004,2003,2002,2001,2000,1999,1998,1997,1996,1995,1994,1993,1992,1991,1990,1989,1988,1987,1986,1985,1984,1983,1982,1981,1980,1979,1978,1977,1976,1975,1974,1973,1972,1971,1970,1969,1968,1967,1966,1965,1964,1963,1962,1961
Estas estadísticas en otros países:
AfghanistanAlbaniaAlgeriaAmerican SamoaAndorraAngolaAntigua and BarbudaArab WorldArgentinaArmeniaArubaAustraliaAustriaAzerbaijanBahamas, TheBahrainBangladeshBarbadosBelarusBelgiumBelizeBeninBermudaBhutanBoliviaBosnia and HerzegovinaBotswanaBrazilBritish Virgin IslandsBrunei DarussalamBulgariaBurkina FasoBurundiCabo VerdeCambodiaCameroonCanadaCaribbean small statesCayman IslandsCentral African RepublicCentral Europe and the BalticsChadChannel IslandsChileChinaColombiaComorosCongo, Dem. Rep.Congo, Rep.Costa RicaCote d'IvoireCroatiaCubaCuracaoCyprusCzech RepublicDenmarkDjiboutiDominicaDominican RepublicEarly-demographic dividendEast Asia & PacificEast Asia & Pacific (excluding high income)East Asia & Pacific (IDA & IBRD countries)EcuadorEgypt, Arab Rep.El SalvadorEquatorial GuineaEritreaEstoniaEthiopiaEuro areaEurope & Central AsiaEurope & Central Asia (excluding high income)Europe & Central Asia (IDA & IBRD countries)European UnionFaroe IslandsFijiFinlandFragile and conflict affected situationsFranceFrench PolynesiaGabonGambia, TheGeorgiaGermanyGhanaGibraltarGreeceGreenlandGrenadaGuamGuatemalaGuineaGuinea-BissauGuyanaHaitiHeavily indebted poor countries (HIPC)High incomeHondurasHong Kong SAR, ChinaHungaryIBRD onlyIcelandIDA & IBRD totalIDA blendIDA onlyIDA totalIndiaIndonesiaIran, Islamic Rep.IraqIrelandIsle of ManIsraelItalyJamaicaJapanJordanKazakhstanKenyaKiribatiKorea, Dem. People’s Rep.Korea, Rep.KuwaitKyrgyz RepublicLao PDRLate-demographic dividendLatin America & Caribbean Latin America & Caribbean (excluding high income)Latin America & the Caribbean (IDA & IBRD countries)LatviaLeast developed countries: UN classificationLebanonLesothoLiberiaLibyaLiechtensteinLithuaniaLow & middle incomeLow incomeLower middle incomeLuxembourgMacao SAR, ChinaMacedonia, FYRMadagascarMalawiMalaysiaMaldivesMaliMaltaMarshall IslandsMauritaniaMauritiusMexicoMicronesia, Fed. Sts.Middle East & North AfricaMiddle East & North Africa (excluding high income)Middle East & North Africa (IDA & IBRD countries)Middle incomeMoldovaMonacoMongoliaMontenegroMoroccoMozambiqueMyanmarNamibiaNauruNepalNetherlandsNew CaledoniaNew ZealandNicaraguaNigerNigeriaNorth AmericaNorthern Mariana IslandsNorwayOECD membersOmanOther small statesPacific island small statesPakistanPalauPanamaPapua New GuineaParaguayPeruPhilippinesPolandPortugalPost-demographic dividendPre-demographic dividendPuerto RicoQatarRomaniaRussian FederationRwandaSamoaSan MarinoSao Tome and PrincipeSaudi ArabiaSenegalSerbiaSeychellesSierra LeoneSingaporeSint Maarten (Dutch part)Slovak RepublicSloveniaSmall statesSolomon IslandsSomaliaSouth AfricaSouth AsiaSouth Asia (IDA & IBRD)South SudanSpainSri LankaSt. Kitts and NevisSt. LuciaSt. Vincent and the GrenadinesSub-Saharan Africa Sub-Saharan Africa (excluding high income)Sub-Saharan Africa (IDA & IBRD countries)SudanSurinameSwazilandSwedenSwitzerlandSyrian Arab RepublicTajikistanTanzaniaThailandTimor-LesteTogoTongaTrinidad and TobagoTunisiaTurkeyTurkmenistanTurks and Caicos IslandsTuvaluUgandaUkraineUnited Arab EmiratesUnited KingdomUnited StatesUpper middle incomeUruguayUzbekistanVanuatuVenezuela, RBVietnamVirgin Islands (U.S.)West Bank and GazaWorldYemen, Rep.ZambiaZimbabwe línea de tiempo (timeline):
En esta escala de tiempo se presenta un gráfico de 1961 y 2016 de Georgia. Los datos de 1960 están ausentes. El número de observaciones reales por fecha: 56.
Fuente (nombre):
Indicadores del desarrollo mundial
Fuente (organización):
World Bank Staff estimates based on United Nations, World Urbanization Prospects.
Categorías:
Agriculture & Rural Development
Se ha actualizado:
23 abr 2017 año
Los indicadores de los cambios de valor en los últimos años
Mínimo:
44.723
1 ene 1990 año
Máximo:
56.931
1 ene 1961 año
A la fecha de observación
Valor
Cambio absoluto
El cambio con respecto al valor anterior
1 ene 1961 año
56.931
+56.931
0.0%
1 ene 1962 año
56.441
-0.49
-0.86%
1 ene 1963 año
55.949
-0.492
-0.87%
1 ene 1964 año
55.456
-0.493
-0.88%
1 ene 1965 año
54.961
-0.495
-0.89%
1 ene 1966 año
54.466
-0.495
-0.9%
1 ene 1967 año
53.97
-0.496
-0.91%
1 ene 1968 año
53.473
-0.497
-0.92%
1 ene 1969 año
52.975
-0.498
-0.93%
1 ene 1970 año
52.478
-0.497
-0.94%
1 ene 1971 año
51.994
-0.484
-0.92%
1 ene 1972 año
51.526
-0.468
-0.9%
1 ene 1973 año
51.058
-0.468
-0.91%
1 ene 1974 año
50.591
-0.467
-0.91%
1 ene 1975 año
50.124
-0.467
-0.92%
1 ene 1976 año
49.656
-0.468
-0.93%
1 ene 1977 año
49.188
-0.468
-0.94%
1 ene 1978 año
48.721
-0.467
-0.95%
1 ene 1979 año
48.253
-0.468
-0.96%
1 ene 1980 año
47.844
-0.409
-0.85%
1 ene 1981 año
47.503
-0.341
-0.71%
1 ene 1982 año
47.164
-0.339
-0.71%
1 ene 1983 año
46.824
-0.34
-0.72%
1 ene 1984 año
46.484
-0.34
-0.73%
1 ene 1985 año
46.145
-0.339
-0.73%
1 ene 1986 año
45.806
-0.339
-0.73%
1 ene 1987 año
45.468
-0.338
-0.74%
1 ene 1988 año
45.13
-0.338
-0.74%
1 ene 1989 año
44.792
-0.338
-0.75%
1 ene 1990 año
44.723
-0.069
-0.15%
1 ene 1991 año
44.962
+0.239
0.53%
1 ene 1992 año
45.201
+0.239
0.53%
1 ene 1993 año
45.441
+0.24
0.53%
1 ene 1994 año
45.68
+0.239
0.53%
1 ene 1995 año
45.92
+0.24
0.53%
1 ene 1996 año
46.159
+0.239
0.52%
1 ene 1997 año
46.4
+0.241
0.52%
1 ene 1998 año
46.64
+0.24
0.52%
1 ene 1999 año
46.88
+0.24
0.51%
1 ene 2000 año
47.121
+0.241
0.51%
1 ene 2001 año
47.362
+0.241
0.51%
1 ene 2002 año
47.602
+0.24
0.51%
1 ene 2003 año
47.707
+0.105
0.22%
1 ene 2004 año
47.648
-0.059
-0.12%
1 ene 2005 año
47.589
-0.059
-0.12%
1 ene 2006 año
47.53
-0.059
-0.12%
1 ene 2007 año
47.475
-0.055
-0.12%
1 ene 2008 año
47.425
-0.05
-0.11%
1 ene 2009 año
47.375
-0.05
-0.11%
1 ene 2010 año
47.277
-0.098
-0.21%
1 ene 2011 año
47.131
-0.146
-0.31%
1 ene 2012 año
46.984
-0.147
-0.31%
1 ene 2013 año
46.838
-0.146
-0.31%
1 ene 2014 año
46.691
-0.147
-0.31%
1 ene 2015 año
46.532
-0.159
-0.34%
1 ene 2016 año
46.359
-0.173
-0.37%
Ranking de los países por los datos estadísticos actuales


Comentarios: