29
/es/
es
AIzaSyAYiBZKx7MnpbEhh9jyipgxe19OcubqV5w
April 1, 2024
212349
Niger
NER
true
2
1
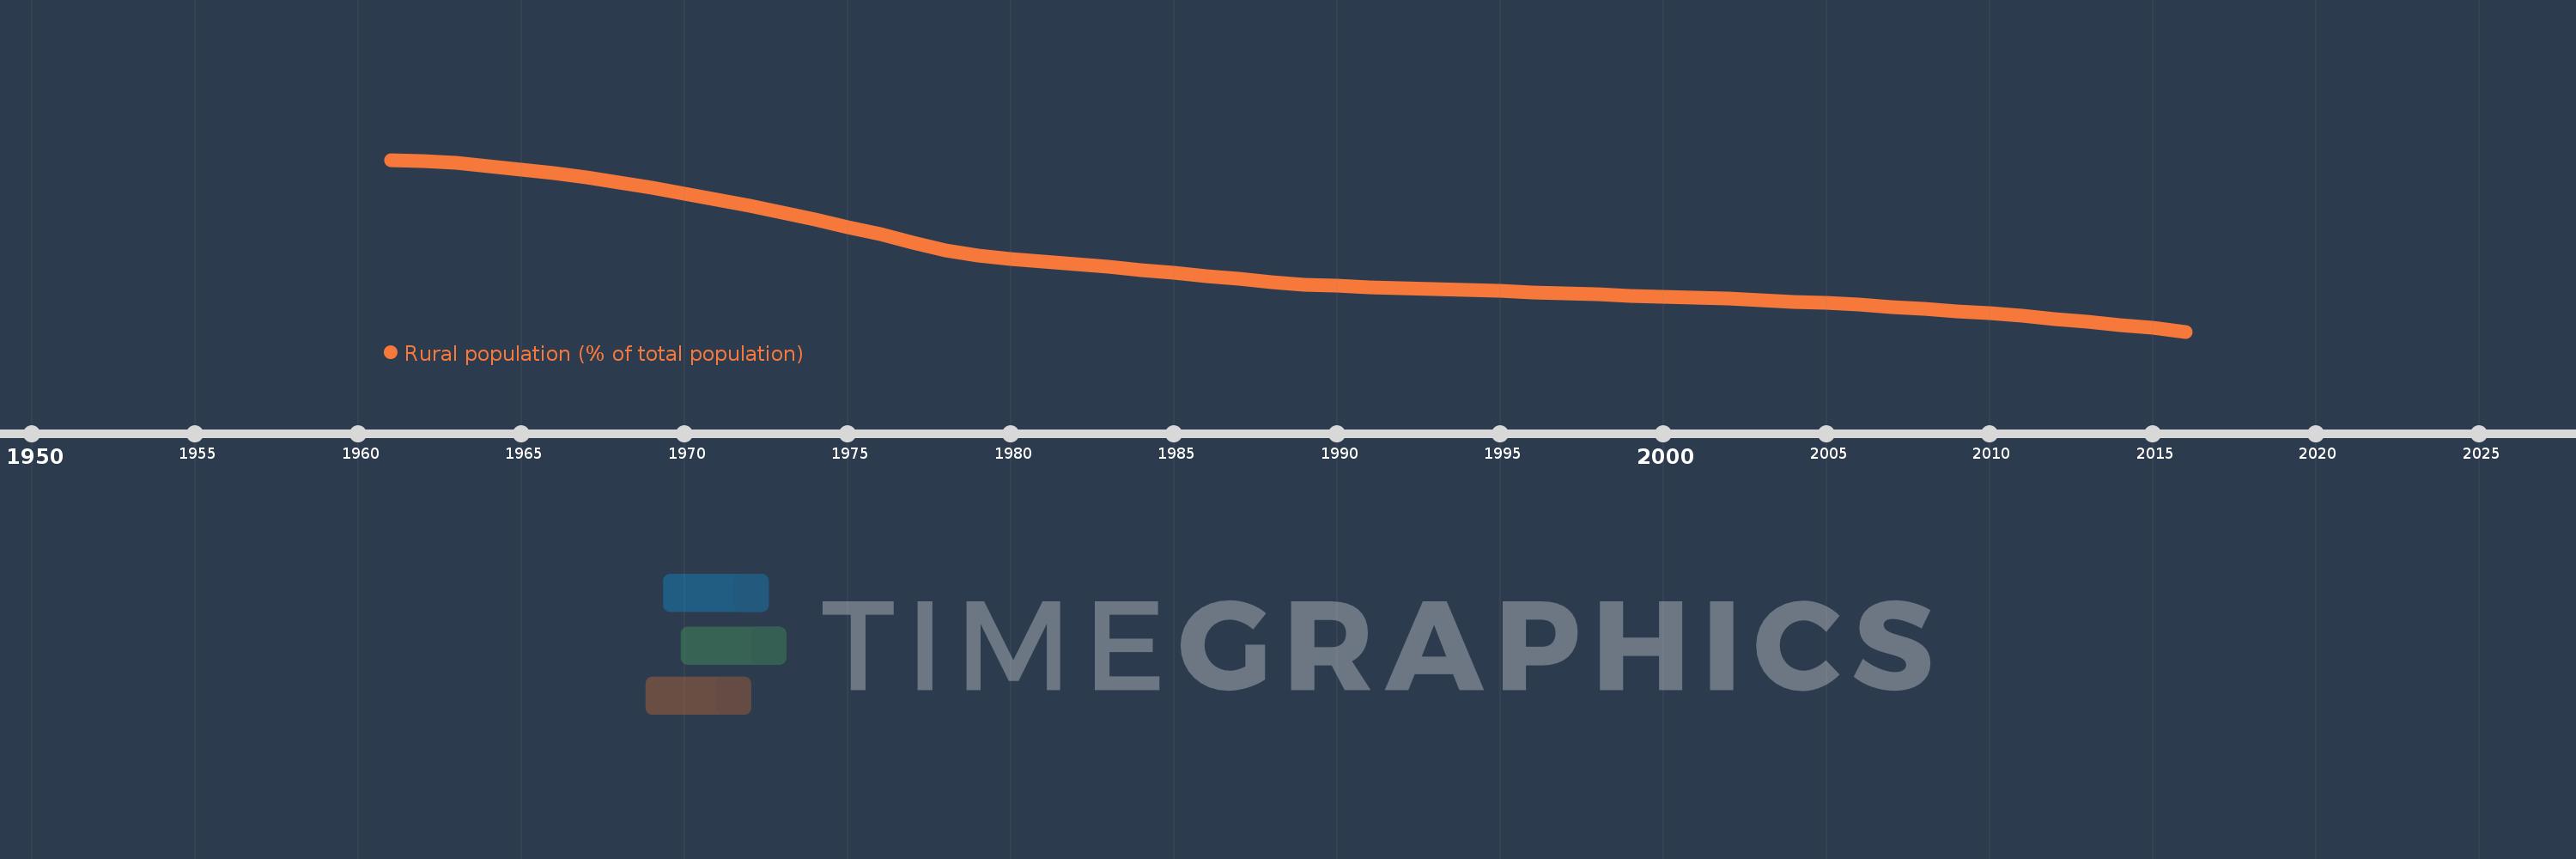
Rural population (% of total population)
2016,2015,2014,2013,2012,2011,2010,2009,2008,2007,2006,2005,2004,2003,2002,2001,2000,1999,1998,1997,1996,1995,1994,1993,1992,1991,1990,1989,1988,1987,1986,1985,1984,1983,1982,1981,1980,1979,1978,1977,1976,1975,1974,1973,1972,1971,1970,1969,1968,1967,1966,1965,1964,1963,1962,1961
Estas estadísticas en otros países:
AfghanistanAlbaniaAlgeriaAmerican SamoaAndorraAngolaAntigua and BarbudaArab WorldArgentinaArmeniaArubaAustraliaAustriaAzerbaijanBahamas, TheBahrainBangladeshBarbadosBelarusBelgiumBelizeBeninBermudaBhutanBoliviaBosnia and HerzegovinaBotswanaBrazilBritish Virgin IslandsBrunei DarussalamBulgariaBurkina FasoBurundiCabo VerdeCambodiaCameroonCanadaCaribbean small statesCayman IslandsCentral African RepublicCentral Europe and the BalticsChadChannel IslandsChileChinaColombiaComorosCongo, Dem. Rep.Congo, Rep.Costa RicaCote d'IvoireCroatiaCubaCuracaoCyprusCzech RepublicDenmarkDjiboutiDominicaDominican RepublicEarly-demographic dividendEast Asia & PacificEast Asia & Pacific (excluding high income)East Asia & Pacific (IDA & IBRD countries)EcuadorEgypt, Arab Rep.El SalvadorEquatorial GuineaEritreaEstoniaEthiopiaEuro areaEurope & Central AsiaEurope & Central Asia (excluding high income)Europe & Central Asia (IDA & IBRD countries)European UnionFaroe IslandsFijiFinlandFragile and conflict affected situationsFranceFrench PolynesiaGabonGambia, TheGeorgiaGermanyGhanaGibraltarGreeceGreenlandGrenadaGuamGuatemalaGuineaGuinea-BissauGuyanaHaitiHeavily indebted poor countries (HIPC)High incomeHondurasHong Kong SAR, ChinaHungaryIBRD onlyIcelandIDA & IBRD totalIDA blendIDA onlyIDA totalIndiaIndonesiaIran, Islamic Rep.IraqIrelandIsle of ManIsraelItalyJamaicaJapanJordanKazakhstanKenyaKiribatiKorea, Dem. People’s Rep.Korea, Rep.KuwaitKyrgyz RepublicLao PDRLate-demographic dividendLatin America & Caribbean Latin America & Caribbean (excluding high income)Latin America & the Caribbean (IDA & IBRD countries)LatviaLeast developed countries: UN classificationLebanonLesothoLiberiaLibyaLiechtensteinLithuaniaLow & middle incomeLow incomeLower middle incomeLuxembourgMacao SAR, ChinaMacedonia, FYRMadagascarMalawiMalaysiaMaldivesMaliMaltaMarshall IslandsMauritaniaMauritiusMexicoMicronesia, Fed. Sts.Middle East & North AfricaMiddle East & North Africa (excluding high income)Middle East & North Africa (IDA & IBRD countries)Middle incomeMoldovaMonacoMongoliaMontenegroMoroccoMozambiqueMyanmarNamibiaNauruNepalNetherlandsNew CaledoniaNew ZealandNicaraguaNigerNigeriaNorth AmericaNorthern Mariana IslandsNorwayOECD membersOmanOther small statesPacific island small statesPakistanPalauPanamaPapua New GuineaParaguayPeruPhilippinesPolandPortugalPost-demographic dividendPre-demographic dividendPuerto RicoQatarRomaniaRussian FederationRwandaSamoaSan MarinoSao Tome and PrincipeSaudi ArabiaSenegalSerbiaSeychellesSierra LeoneSingaporeSint Maarten (Dutch part)Slovak RepublicSloveniaSmall statesSolomon IslandsSomaliaSouth AfricaSouth AsiaSouth Asia (IDA & IBRD)South SudanSpainSri LankaSt. Kitts and NevisSt. LuciaSt. Vincent and the GrenadinesSub-Saharan Africa Sub-Saharan Africa (excluding high income)Sub-Saharan Africa (IDA & IBRD countries)SudanSurinameSwazilandSwedenSwitzerlandSyrian Arab RepublicTajikistanTanzaniaThailandTimor-LesteTogoTongaTrinidad and TobagoTunisiaTurkeyTurkmenistanTurks and Caicos IslandsTuvaluUgandaUkraineUnited Arab EmiratesUnited KingdomUnited StatesUpper middle incomeUruguayUzbekistanVanuatuVenezuela, RBVietnamVirgin Islands (U.S.)West Bank and GazaWorldYemen, Rep.ZambiaZimbabwe línea de tiempo (timeline):
En esta escala de tiempo se presenta un gráfico de 1961 y 2016 de Niger. Los datos de 1960 están ausentes. El número de observaciones reales por fecha: 56.
Fuente (nombre):
Indicadores del desarrollo mundial
Fuente (organización):
World Bank Staff estimates based on United Nations, World Urbanization Prospects.
Categorías:
Agriculture & Rural Development
Se ha actualizado:
23 abr 2017 año
Los indicadores de los cambios de valor en los últimos años
Mínimo:
81.268
1 ene 2016 año
Máximo:
94.207
1 ene 1961 año
A la fecha de observación
Valor
Cambio absoluto
El cambio con respecto al valor anterior
1 ene 1961 año
94.207
+94.207
0.0%
1 ene 1962 año
94.104
-0.103
-0.11%
1 ene 1963 año
94.0
-0.104
-0.11%
1 ene 1964 año
93.741
-0.259
-0.28%
1 ene 1965 año
93.471
-0.27
-0.29%
1 ene 1966 año
93.191
-0.28
-0.3%
1 ene 1967 año
92.9
-0.291
-0.31%
1 ene 1968 año
92.507
-0.393
-0.42%
1 ene 1969 año
92.094
-0.413
-0.45%
1 ene 1970 año
91.661
-0.433
-0.47%
1 ene 1971 año
91.206
-0.455
-0.5%
1 ene 1972 año
90.729
-0.477
-0.52%
1 ene 1973 año
90.228
-0.501
-0.55%
1 ene 1974 año
89.704
-0.524
-0.58%
1 ene 1975 año
89.155
-0.549
-0.61%
1 ene 1976 año
88.581
-0.574
-0.64%
1 ene 1977 año
87.979
-0.602
-0.68%
1 ene 1978 año
87.352
-0.627
-0.71%
1 ene 1979 año
86.975
-0.377
-0.43%
1 ene 1980 año
86.767
-0.208
-0.24%
1 ene 1981 año
86.557
-0.21
-0.24%
1 ene 1982 año
86.344
-0.213
-0.25%
1 ene 1983 año
86.129
-0.215
-0.25%
1 ene 1984 año
85.91
-0.219
-0.25%
1 ene 1985 año
85.688
-0.222
-0.26%
1 ene 1986 año
85.464
-0.224
-0.26%
1 ene 1987 año
85.237
-0.227
-0.27%
1 ene 1988 año
85.007
-0.23
-0.27%
1 ene 1989 año
84.791
-0.216
-0.25%
1 ene 1990 año
84.711
-0.08
-0.09%
1 ene 1991 año
84.632
-0.079
-0.09%
1 ene 1992 año
84.551
-0.081
-0.1%
1 ene 1993 año
84.471
-0.08
-0.09%
1 ene 1994 año
84.39
-0.081
-0.1%
1 ene 1995 año
84.309
-0.081
-0.1%
1 ene 1996 año
84.227
-0.082
-0.1%
1 ene 1997 año
84.145
-0.082
-0.1%
1 ene 1998 año
84.063
-0.082
-0.1%
1 ene 1999 año
83.98
-0.083
-0.1%
1 ene 2000 año
83.897
-0.083
-0.1%
1 ene 2001 año
83.814
-0.083
-0.1%
1 ene 2002 año
83.73
-0.084
-0.1%
1 ene 2003 año
83.635
-0.095
-0.11%
1 ene 2004 año
83.529
-0.106
-0.13%
1 ene 2005 año
83.41
-0.119
-0.14%
1 ene 2006 año
83.28
-0.13
-0.16%
1 ene 2007 año
83.137
-0.143
-0.17%
1 ene 2008 año
82.982
-0.155
-0.19%
1 ene 2009 año
82.815
-0.167
-0.2%
1 ene 2010 año
82.634
-0.181
-0.22%
1 ene 2011 año
82.441
-0.193
-0.23%
1 ene 2012 año
82.234
-0.207
-0.25%
1 ene 2013 año
82.014
-0.22
-0.27%
1 ene 2014 año
81.78
-0.234
-0.29%
1 ene 2015 año
81.531
-0.249
-0.3%
1 ene 2016 año
81.268
-0.263
-0.32%
Ranking de los países por los datos estadísticos actuales


Comentarios: