29
/es/
es
AIzaSyAYiBZKx7MnpbEhh9jyipgxe19OcubqV5w
April 1, 2024
26103
Central Europe and the Baltics
CEB
false
2
1
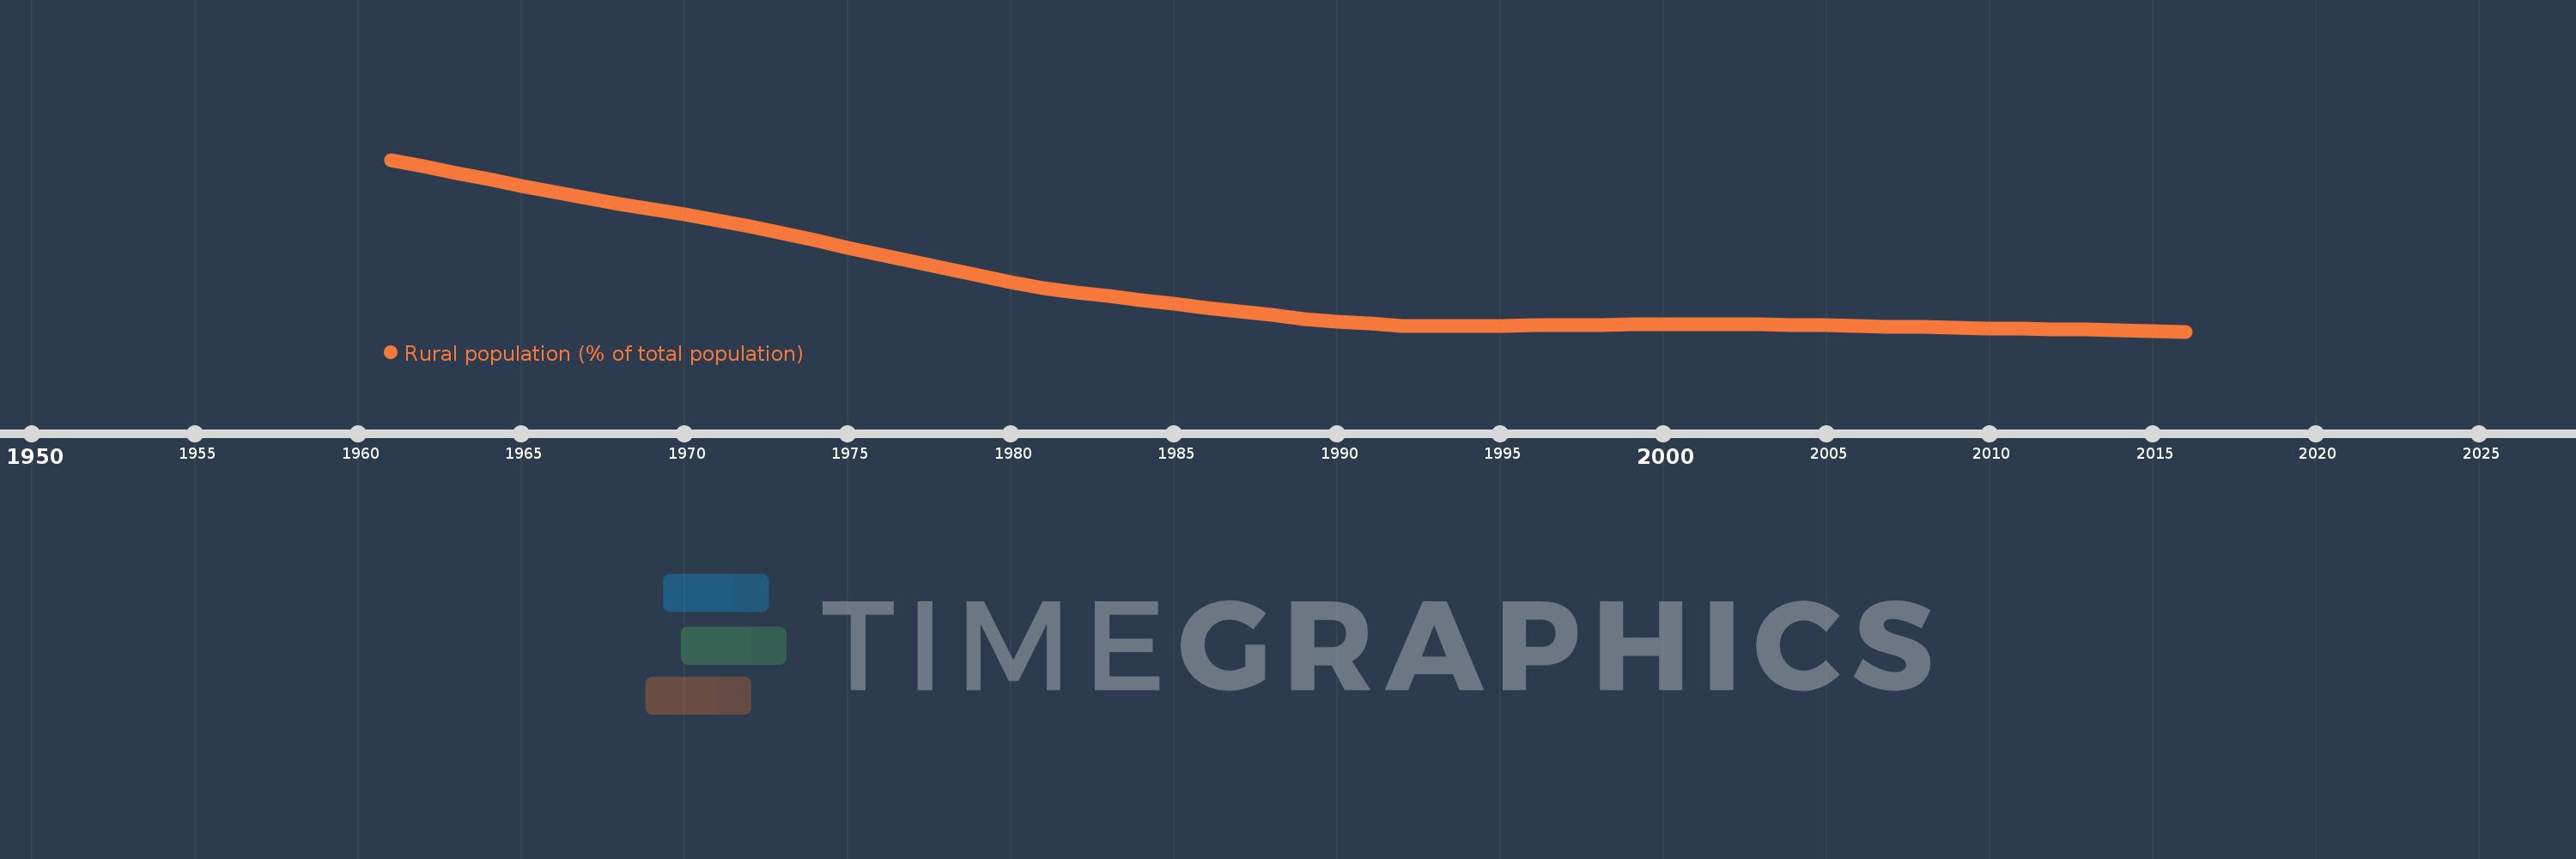
Rural population (% of total population)
2016,2015,2014,2013,2012,2011,2010,2009,2008,2007,2006,2005,2004,2003,2002,2001,2000,1999,1998,1997,1996,1995,1994,1993,1992,1991,1990,1989,1988,1987,1986,1985,1984,1983,1982,1981,1980,1979,1978,1977,1976,1975,1974,1973,1972,1971,1970,1969,1968,1967,1966,1965,1964,1963,1962,1961
Estas estadísticas en otros países:
AfghanistanAlbaniaAlgeriaAmerican SamoaAndorraAngolaAntigua and BarbudaArab WorldArgentinaArmeniaArubaAustraliaAustriaAzerbaijanBahamas, TheBahrainBangladeshBarbadosBelarusBelgiumBelizeBeninBermudaBhutanBoliviaBosnia and HerzegovinaBotswanaBrazilBritish Virgin IslandsBrunei DarussalamBulgariaBurkina FasoBurundiCabo VerdeCambodiaCameroonCanadaCaribbean small statesCayman IslandsCentral African RepublicCentral Europe and the BalticsChadChannel IslandsChileChinaColombiaComorosCongo, Dem. Rep.Congo, Rep.Costa RicaCote d'IvoireCroatiaCubaCuracaoCyprusCzech RepublicDenmarkDjiboutiDominicaDominican RepublicEarly-demographic dividendEast Asia & PacificEast Asia & Pacific (excluding high income)East Asia & Pacific (IDA & IBRD countries)EcuadorEgypt, Arab Rep.El SalvadorEquatorial GuineaEritreaEstoniaEthiopiaEuro areaEurope & Central AsiaEurope & Central Asia (excluding high income)Europe & Central Asia (IDA & IBRD countries)European UnionFaroe IslandsFijiFinlandFragile and conflict affected situationsFranceFrench PolynesiaGabonGambia, TheGeorgiaGermanyGhanaGibraltarGreeceGreenlandGrenadaGuamGuatemalaGuineaGuinea-BissauGuyanaHaitiHeavily indebted poor countries (HIPC)High incomeHondurasHong Kong SAR, ChinaHungaryIBRD onlyIcelandIDA & IBRD totalIDA blendIDA onlyIDA totalIndiaIndonesiaIran, Islamic Rep.IraqIrelandIsle of ManIsraelItalyJamaicaJapanJordanKazakhstanKenyaKiribatiKorea, Dem. People’s Rep.Korea, Rep.KuwaitKyrgyz RepublicLao PDRLate-demographic dividendLatin America & Caribbean Latin America & Caribbean (excluding high income)Latin America & the Caribbean (IDA & IBRD countries)LatviaLeast developed countries: UN classificationLebanonLesothoLiberiaLibyaLiechtensteinLithuaniaLow & middle incomeLow incomeLower middle incomeLuxembourgMacao SAR, ChinaMacedonia, FYRMadagascarMalawiMalaysiaMaldivesMaliMaltaMarshall IslandsMauritaniaMauritiusMexicoMicronesia, Fed. Sts.Middle East & North AfricaMiddle East & North Africa (excluding high income)Middle East & North Africa (IDA & IBRD countries)Middle incomeMoldovaMonacoMongoliaMontenegroMoroccoMozambiqueMyanmarNamibiaNauruNepalNetherlandsNew CaledoniaNew ZealandNicaraguaNigerNigeriaNorth AmericaNorthern Mariana IslandsNorwayOECD membersOmanOther small statesPacific island small statesPakistanPalauPanamaPapua New GuineaParaguayPeruPhilippinesPolandPortugalPost-demographic dividendPre-demographic dividendPuerto RicoQatarRomaniaRussian FederationRwandaSamoaSan MarinoSao Tome and PrincipeSaudi ArabiaSenegalSerbiaSeychellesSierra LeoneSingaporeSint Maarten (Dutch part)Slovak RepublicSloveniaSmall statesSolomon IslandsSomaliaSouth AfricaSouth AsiaSouth Asia (IDA & IBRD)South SudanSpainSri LankaSt. Kitts and NevisSt. LuciaSt. Vincent and the GrenadinesSub-Saharan Africa Sub-Saharan Africa (excluding high income)Sub-Saharan Africa (IDA & IBRD countries)SudanSurinameSwazilandSwedenSwitzerlandSyrian Arab RepublicTajikistanTanzaniaThailandTimor-LesteTogoTongaTrinidad and TobagoTunisiaTurkeyTurkmenistanTurks and Caicos IslandsTuvaluUgandaUkraineUnited Arab EmiratesUnited KingdomUnited StatesUpper middle incomeUruguayUzbekistanVanuatuVenezuela, RBVietnamVirgin Islands (U.S.)West Bank and GazaWorldYemen, Rep.ZambiaZimbabwe línea de tiempo (timeline):
En esta escala de tiempo se presenta un gráfico de 1961 y 2016 de Central Europe and the Baltics. Los datos de 1960 están ausentes. El número de observaciones reales por fecha: 56.
Fuente (nombre):
Indicadores del desarrollo mundial
Fuente (organización):
World Bank Staff estimates based on United Nations, World Urbanization Prospects.
Categorías:
Agriculture & Rural Development
Se ha actualizado:
23 abr 2017 año
Los indicadores de los cambios de valor en los últimos años
Mínimo:
37.644
1 ene 2016 año
Máximo:
55.492
1 ene 1961 año
A la fecha de observación
Valor
Cambio absoluto
El cambio con respecto al valor anterior
1 ene 1961 año
55.492
+55.492
0.0%
1 ene 1962 año
54.793
-0.699
-1.26%
1 ene 1963 año
54.133
-0.66
-1.2%
1 ene 1964 año
53.466
-0.668
-1.23%
1 ene 1965 año
52.791
-0.675
-1.26%
1 ene 1966 año
52.12
-0.672
-1.27%
1 ene 1967 año
51.495
-0.625
-1.2%
1 ene 1968 año
50.932
-0.563
-1.09%
1 ene 1969 año
50.361
-0.571
-1.12%
1 ene 1970 año
49.784
-0.577
-1.15%
1 ene 1971 año
49.22
-0.565
-1.13%
1 ene 1972 año
48.57
-0.649
-1.32%
1 ene 1973 año
47.838
-0.733
-1.51%
1 ene 1974 año
47.106
-0.732
-1.53%
1 ene 1975 año
46.373
-0.733
-1.56%
1 ene 1976 año
45.65
-0.722
-1.56%
1 ene 1977 año
44.939
-0.711
-1.56%
1 ene 1978 año
44.211
-0.728
-1.62%
1 ene 1979 año
43.469
-0.742
-1.68%
1 ene 1980 año
42.787
-0.682
-1.57%
1 ene 1981 año
42.177
-0.61
-1.43%
1 ene 1982 año
41.713
-0.464
-1.1%
1 ene 1983 año
41.316
-0.397
-0.95%
1 ene 1984 año
40.918
-0.398
-0.96%
1 ene 1985 año
40.52
-0.399
-0.97%
1 ene 1986 año
40.126
-0.394
-0.97%
1 ene 1987 año
39.742
-0.384
-0.96%
1 ene 1988 año
39.361
-0.381
-0.96%
1 ene 1989 año
38.98
-0.382
-0.97%
1 ene 1990 año
38.688
-0.292
-0.75%
1 ene 1991 año
38.479
-0.209
-0.54%
1 ene 1992 año
38.258
-0.221
-0.57%
1 ene 1993 año
38.18
-0.079
-0.21%
1 ene 1994 año
38.221
+0.041
0.11%
1 ene 1995 año
38.249
+0.028
0.07%
1 ene 1996 año
38.284
+0.035
0.09%
1 ene 1997 año
38.304
+0.02
0.05%
1 ene 1998 año
38.338
+0.034
0.09%
1 ene 1999 año
38.367
+0.029
0.08%
1 ene 2000 año
38.405
+0.038
0.1%
1 ene 2001 año
38.433
+0.028
0.07%
1 ene 2002 año
38.428
-0.004
-0.01%
1 ene 2003 año
38.368
-0.06
-0.16%
1 ene 2004 año
38.326
-0.042
-0.11%
1 ene 2005 año
38.283
-0.042
-0.11%
1 ene 2006 año
38.233
-0.05
-0.13%
1 ene 2007 año
38.176
-0.057
-0.15%
1 ene 2008 año
38.112
-0.064
-0.17%
1 ene 2009 año
38.035
-0.077
-0.2%
1 ene 2010 año
37.98
-0.055
-0.15%
1 ene 2011 año
37.941
-0.039
-0.1%
1 ene 2012 año
37.9
-0.04
-0.11%
1 ene 2013 año
37.858
-0.042
-0.11%
1 ene 2014 año
37.802
-0.056
-0.15%
1 ene 2015 año
37.731
-0.072
-0.19%
1 ene 2016 año
37.644
-0.086
-0.23%
Ranking de los países por los datos estadísticos actuales


Comentarios: