29
/es/
es
AIzaSyAYiBZKx7MnpbEhh9jyipgxe19OcubqV5w
April 1, 2024
125556
Egypt, Arab Rep.
EGY
true
2
1
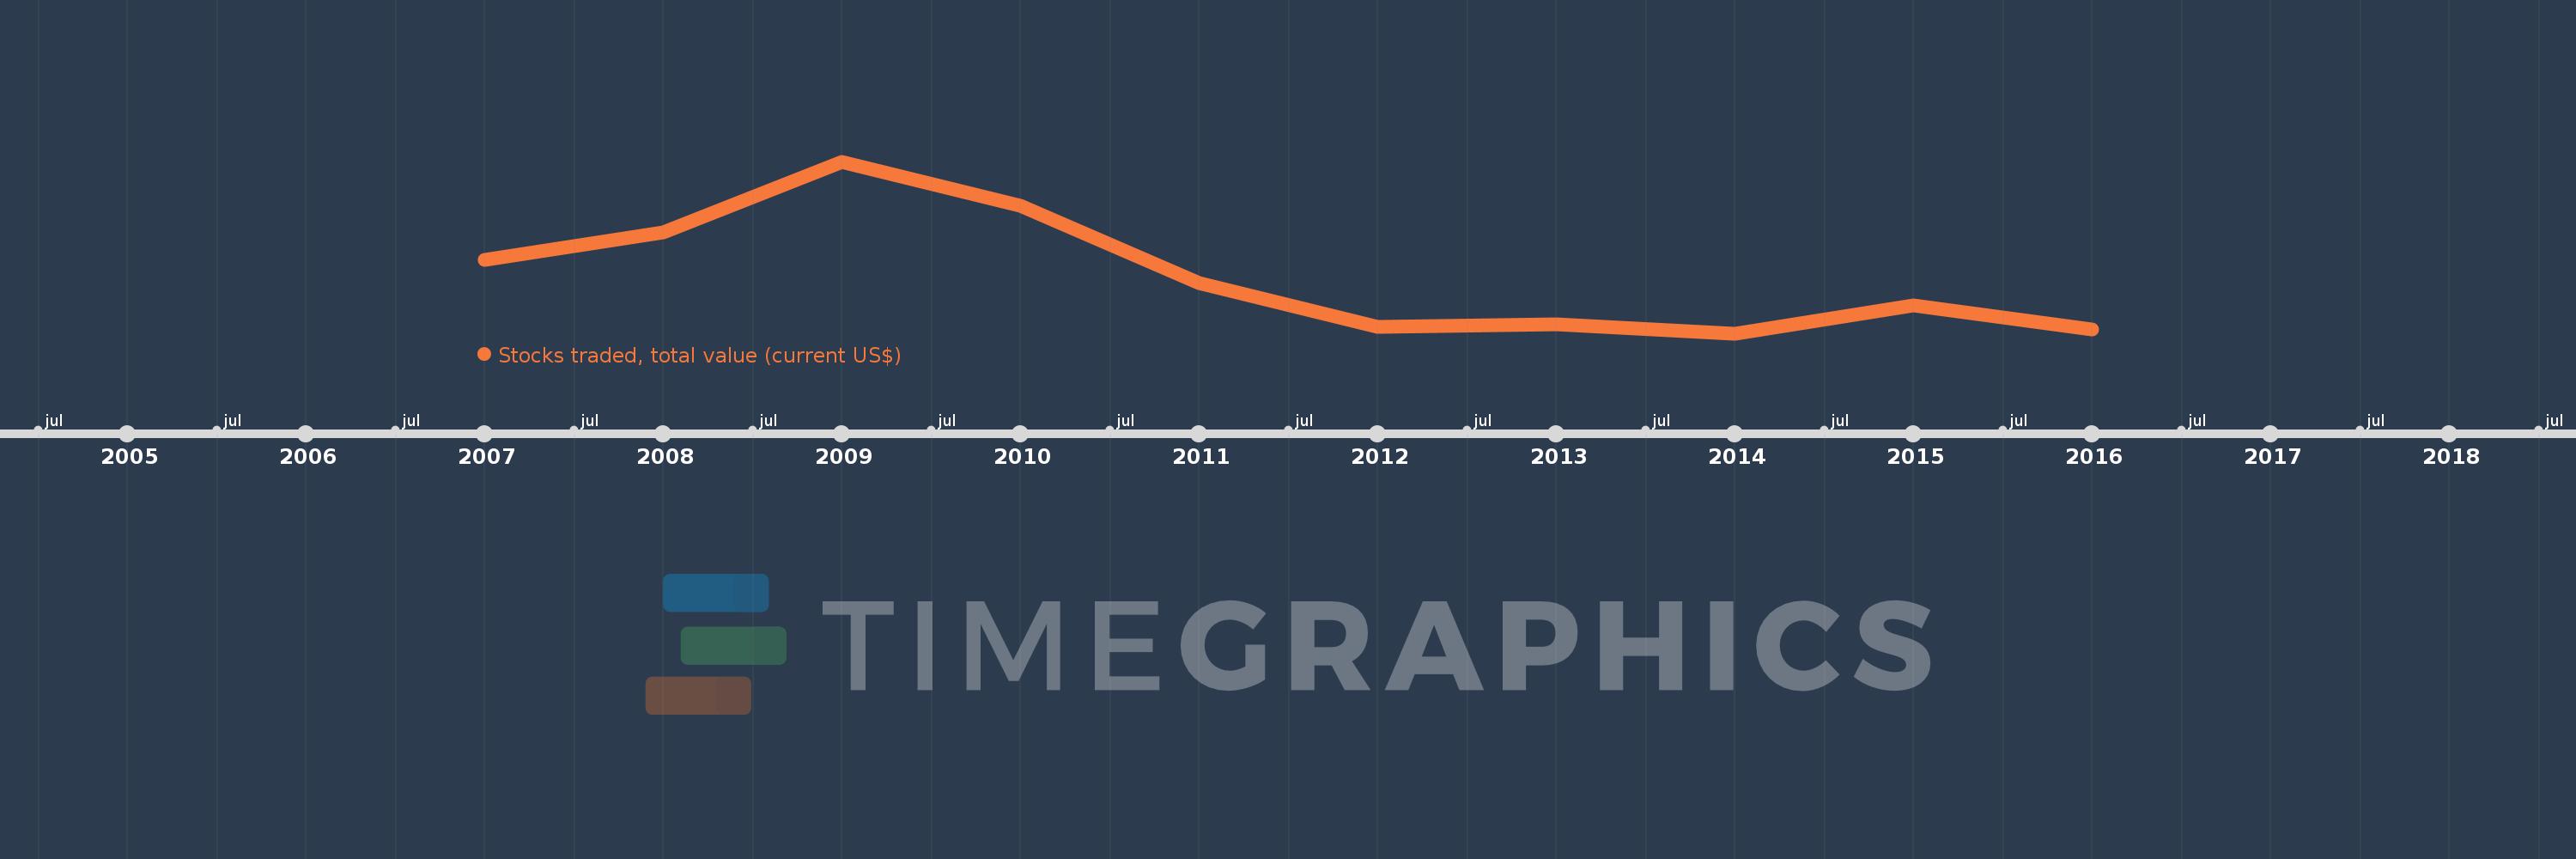
Stocks traded, total value (current US$)
2016,2015,2014,2013,2012,2011,2010,2009,2008,2007
Estas estadísticas en otros países:
línea de tiempo (timeline):
En esta escala de tiempo se presenta un gráfico de 2007 y 2016 de Egypt, Arab Rep.. Los datos de 2006 están ausentes. El número de observaciones reales por fecha: 10.
Fuente (nombre):
Indicadores del desarrollo mundial
Fuente (organización):
World Federation of Exchanges database.
Categorías:
Financial Sector
Se ha actualizado:
23 abr 2017 año
Los indicadores de los cambios de valor en los últimos años
Mínimo:
12.735 bn
1 ene 2014 año
Máximo:
95.827 bn
1 ene 2009 año
A la fecha de observación
Valor
Cambio absoluto
El cambio con respecto al valor anterior
1 ene 2007 año
48.364 bn
+48.364 bn
0.0%
1 ene 2008 año
61.518 bn
+13.154 bn
27.2%
1 ene 2009 año
95.827 bn
+34.309 bn
55.77%
1 ene 2010 año
74.374 bn
-21.452 bn
-22.39%
1 ene 2011 año
37.215 bn
-37.159 bn
-49.96%
1 ene 2012 año
15.898 bn
-21.318 bn
-57.28%
1 ene 2013 año
17.093 bn
+1.196 bn
7.52%
1 ene 2014 año
12.735 bn
-4.358 bn
-25.5%
1 ene 2015 año
26.441 bn
+13.706 bn
107.62%
1 ene 2016 año
14.76 bn
-11.681 bn
-44.18%
Ranking de los países por los datos estadísticos actuales


Comentarios: