30
/es/
AIzaSyAYiBZKx7MnpbEhh9jyipgxe19OcubqV5w
April 1, 2024
38603
IDA blend
IDB
false
2
1
Stocks traded, total value (current US$)
2015,2014,2013,2012,2011,2010,2009,2008,2007,2006,2005,2002,2000,1999,1998,1997,1996
Download
Estadísticas Globales de la Biblioteca →IDA blend →

Stocks traded, total value (current US$)

Estas estadísticas en otros países:

Arab WorldArgentinaArmeniaAustraliaAustriaBahrainBangladeshBarbadosBelgiumBermudaBoliviaBotswanaBrazilBulgariaCanadaCayman IslandsCentral Europe and the BalticsChannel IslandsChileChinaColombiaCosta RicaCote d'IvoireCroatiaCyprusCzech RepublicDenmarkEarly-demographic dividendEast Asia & PacificEast Asia & Pacific (excluding high income)East Asia & Pacific (IDA & IBRD countries)EcuadorEgypt, Arab Rep.El SalvadorEstoniaEuro areaEurope & Central AsiaEurope & Central Asia (excluding high income)Europe & Central Asia (IDA & IBRD countries)European UnionFijiFinlandFranceGeorgiaGermanyGhanaGreeceGuyanaHigh incomeHong Kong SAR, ChinaHungaryIBRD onlyIcelandIDA & IBRD totalIDA blendIDA totalIndiaIndonesiaIran, Islamic Rep.IrelandIsraelItalyJamaicaJapanJordanKazakhstanKenyaKorea, Rep.KuwaitKyrgyz RepublicLate-demographic dividendLatin America & Caribbean Latin America & Caribbean (excluding high income)Latin America & the Caribbean (IDA & IBRD countries)LatviaLebanonLithuaniaLow & middle incomeLower middle incomeLuxembourgMacedonia, FYRMalawiMalaysiaMaltaMauritiusMexicoMiddle East & North AfricaMiddle East & North Africa (excluding high income)Middle East & North Africa (IDA & IBRD countries)Middle incomeMoldovaMongoliaMontenegroMoroccoNamibiaNetherlandsNew ZealandNigeriaNorth AmericaNorwayOECD membersOmanOther small statesPakistanPanamaPapua New GuineaParaguayPeruPhilippinesPolandPortugalPost-demographic dividendQatarRomaniaRussian FederationSaudi ArabiaSerbiaSeychellesSingaporeSlovak RepublicSloveniaSouth AfricaSouth AsiaSouth Asia (IDA & IBRD)SpainSri LankaSt. Kitts and NevisSub-Saharan Africa Sub-Saharan Africa (excluding high income)Sub-Saharan Africa (IDA & IBRD countries)SwazilandSwedenSwitzerlandTanzaniaThailandTrinidad and TobagoTunisiaTurkeyUgandaUkraineUnited Arab EmiratesUnited KingdomUnited StatesUpper middle incomeUruguayUzbekistanVenezuela, RBVietnamWest Bank and GazaWorldZambiaZimbabwe

línea de tiempo (timeline):

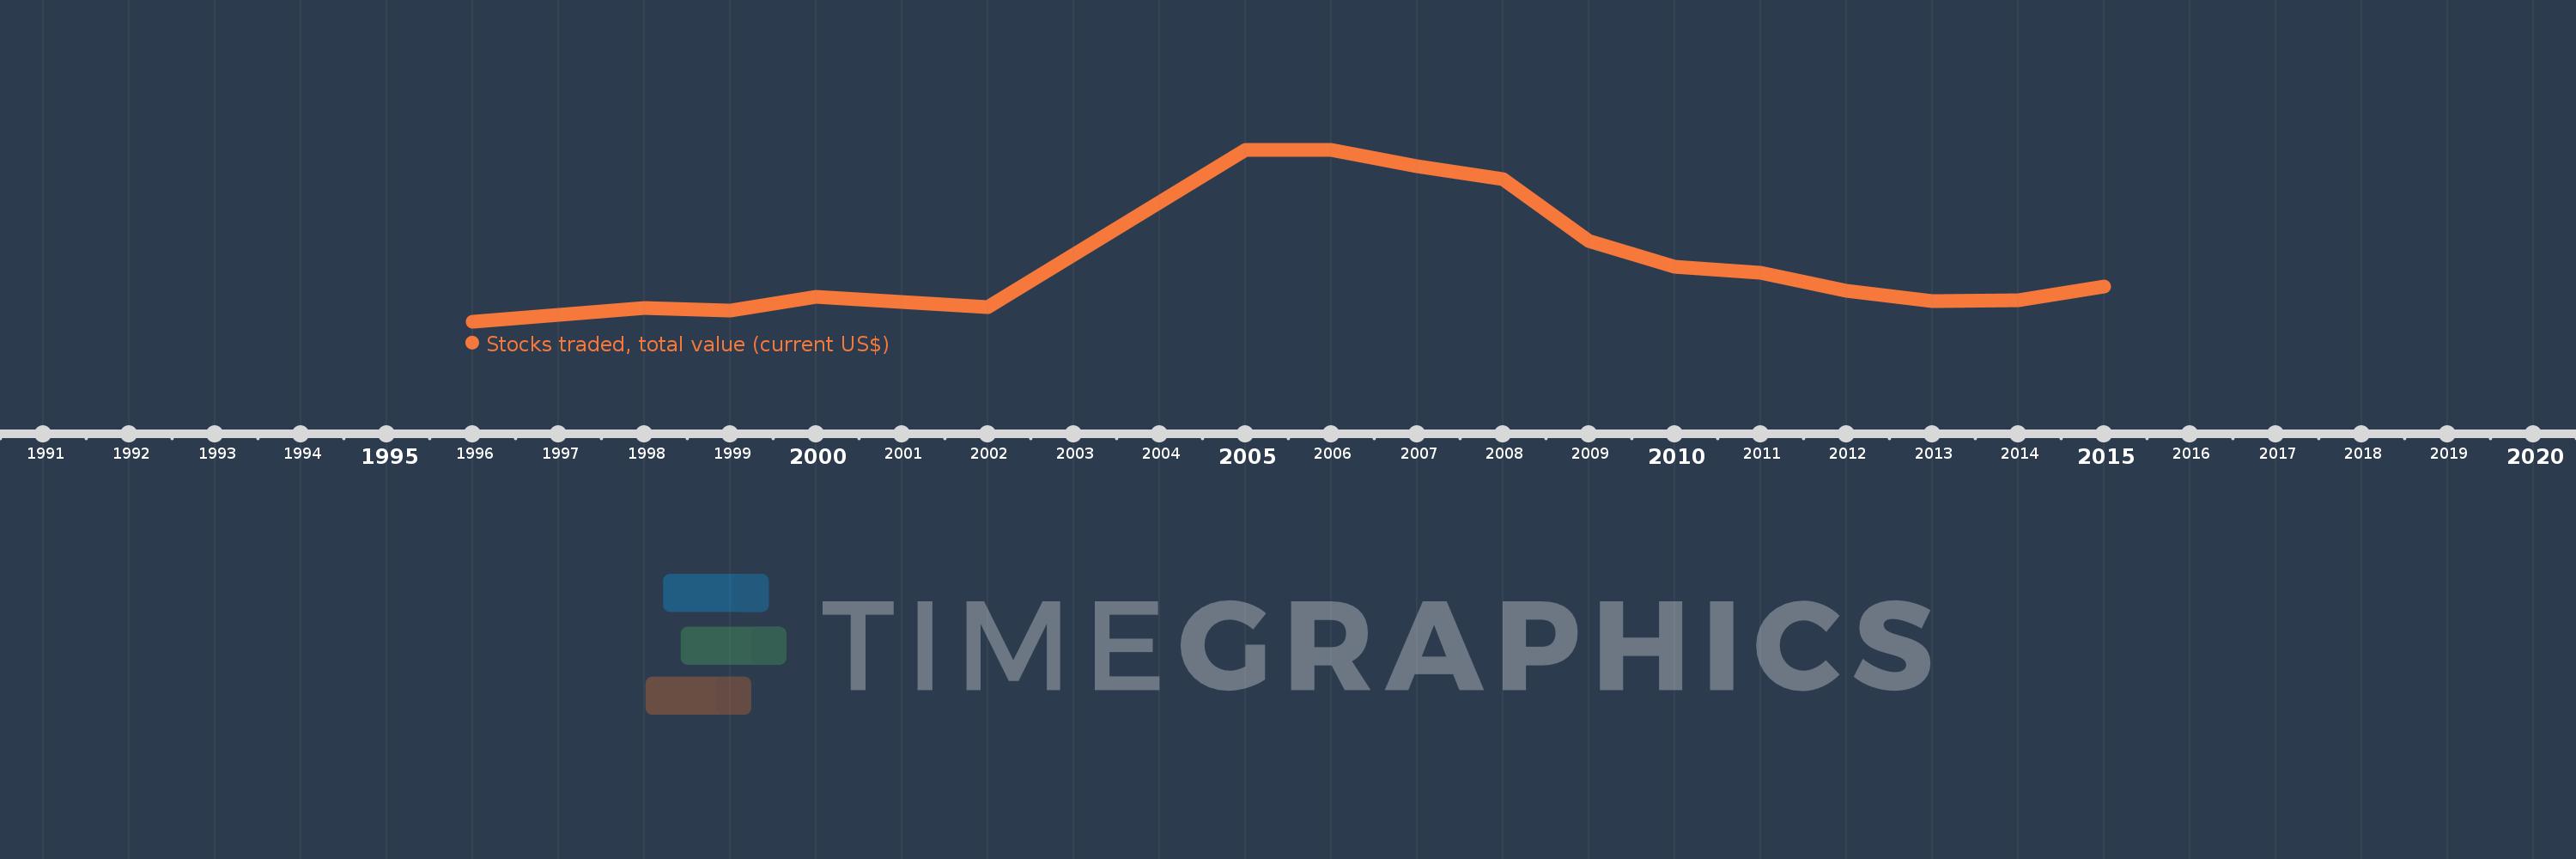
En esta escala de tiempo se presenta un gráfico de 1996 y 2015 de IDA blend. Los datos de 1995 están ausentes. El número de observaciones reales por fecha: 17.

Fuente (nombre):

Indicadores del desarrollo mundial

Fuente (organización):

World Federation of Exchanges database.

Categorías:

Financial Sector

Se ha actualizado:

23 abr 2017 año

Los indicadores de los cambios de valor en los últimos años

En promedio:
49.591 bn
Mínimo:
470.53 millones
1 ene 1996 año
Máximo:
142.6 bn
1 ene 2005 año
A la fecha de observación
Valor
Cambio absoluto
El cambio con respecto al valor anterior
1 ene 1996 año
470.53 millones
+470.53 millones
0.0%
1 ene 1997 año
6.25 bn
+5.779 bn
1.23 mil%
1 ene 1998 año
11.781 bn
+5.532 bn
88.51%
1 ene 1999 año
10.061 bn
-1.72 bn
-14.6%
1 ene 2000 año
21.425 bn
+11.364 bn
112.95%
1 ene 2002 año
12.79 bn
-8.635 bn
-40.3%
1 ene 2005 año
142.6 bn
+129.81 bn
1.01 mil%
1 ene 2006 año
142.546 bn
-54.037 millones
-0.04%
1 ene 2007 año
129.492 bn
-13.054 bn
-9.16%
1 ene 2008 año
118.457 bn
-11.035 bn
-8.52%
1 ene 2009 año
67.443 bn
-51.013 bn
-43.07%
1 ene 2010 año
46.093 bn
-21.35 bn
-31.66%
1 ene 2011 año
41.023 bn
-5.07 bn
-11.0%
1 ene 2012 año
26.013 bn
-15.01 bn
-36.59%
1 ene 2013 año
17.803 bn
-8.21 bn
-31.56%
1 ene 2014 año
18.733 bn
+929.828 millones
5.22%
1 ene 2015 año
30.073 bn
+11.34 bn
60.53%

Ranking de los países por los datos estadísticos actuales