29
/es/
es
AIzaSyAYiBZKx7MnpbEhh9jyipgxe19OcubqV5w
April 1, 2024
58562
South Asia (IDA & IBRD)
TSA
false
2
1
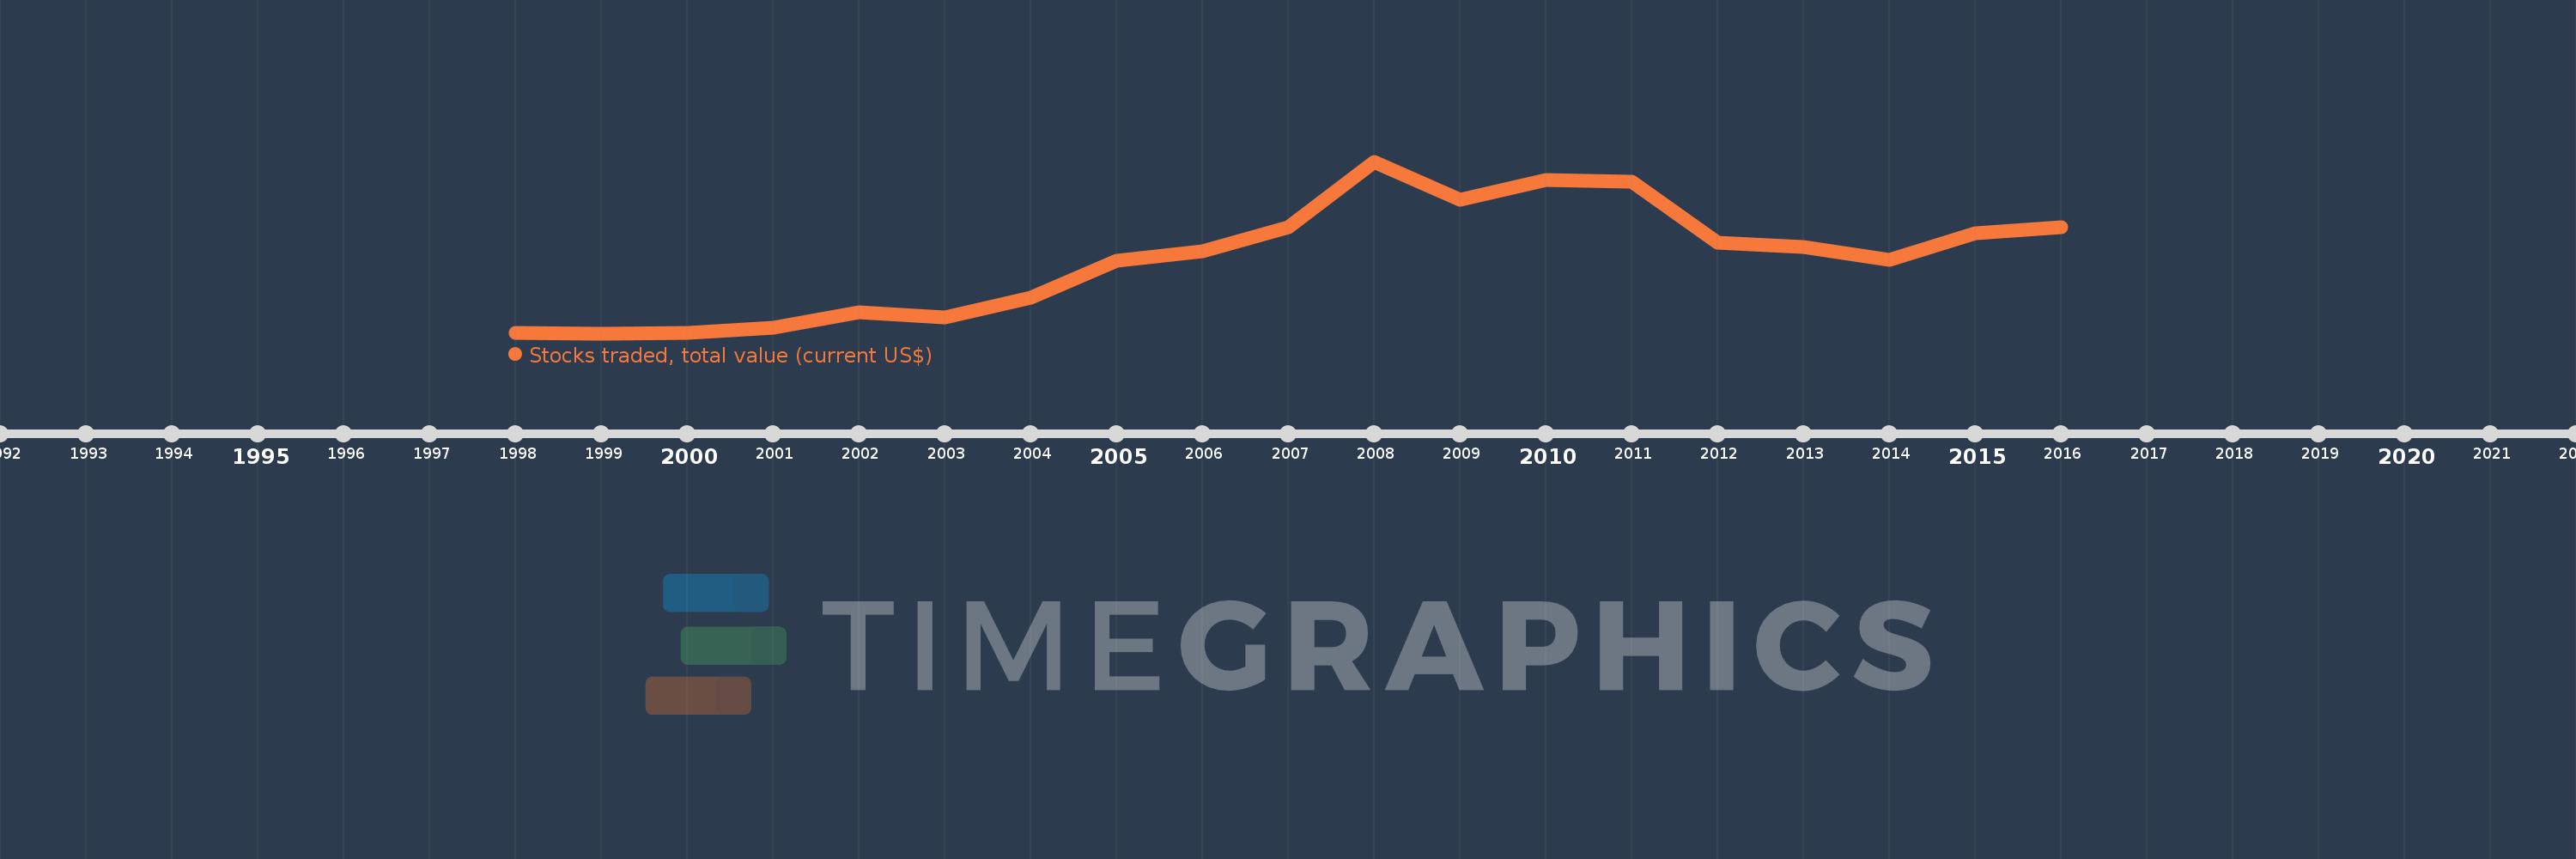
Stocks traded, total value (current US$)
2016,2015,2014,2013,2012,2011,2010,2009,2008,2007,2006,2005,2004,2003,2002,2001,2000,1999,1998
Estas estadísticas en otros países:
línea de tiempo (timeline):
En esta escala de tiempo se presenta un gráfico de 1998 y 2016 de South Asia (IDA & IBRD). Los datos de 1997 están ausentes. El número de observaciones reales por fecha: 19.
Fuente (nombre):
Indicadores del desarrollo mundial
Fuente (organización):
World Federation of Exchanges database.
Categorías:
Financial Sector
Se ha actualizado:
23 abr 2017 año
Los indicadores de los cambios de valor en los últimos años
Mínimo:
17.0 bn
1 ene 1999 año
Máximo:
1.245 billones
1 ene 2008 año
A la fecha de observación
Valor
Cambio absoluto
El cambio con respecto al valor anterior
1 ene 1998 año
18.694 bn
+18.694 bn
0.0%
1 ene 1999 año
17.0 bn
-1.694 bn
-9.06%
1 ene 2000 año
22.001 bn
+5.001 bn
29.42%
1 ene 2001 año
54.025 bn
+32.024 bn
145.56%
1 ene 2002 año
164.717 bn
+110.692 bn
204.89%
1 ene 2003 año
128.82 bn
-35.897 bn
-21.79%
1 ene 2004 año
272.753 bn
+143.934 bn
111.73%
1 ene 2005 año
533.868 bn
+261.115 bn
95.73%
1 ene 2006 año
604.582 bn
+70.713 bn
13.25%
1 ene 2007 año
777.829 bn
+173.248 bn
28.66%
1 ene 2008 año
1.245 billones
+467.06 bn
60.05%
1 ene 2009 año
970.165 bn
-274.725 bn
-22.07%
1 ene 2010 año
1.112 billones
+141.569 bn
14.59%
1 ene 2011 año
1.103 billones
-9.192 bn
-0.83%
1 ene 2012 año
662.103 bn
-440.439 bn
-39.95%
1 ene 2013 año
631.167 bn
-30.936 bn
-4.67%
1 ene 2014 año
541.109 bn
-90.058 bn
-14.27%
1 ene 2015 año
733.843 bn
+192.735 bn
35.62%
1 ene 2016 año
773.791 bn
+39.948 bn
5.44%
Ranking de los países por los datos estadísticos actuales


Comentarios: