29
/es/
es
AIzaSyAYiBZKx7MnpbEhh9jyipgxe19OcubqV5w
April 1, 2024
55182
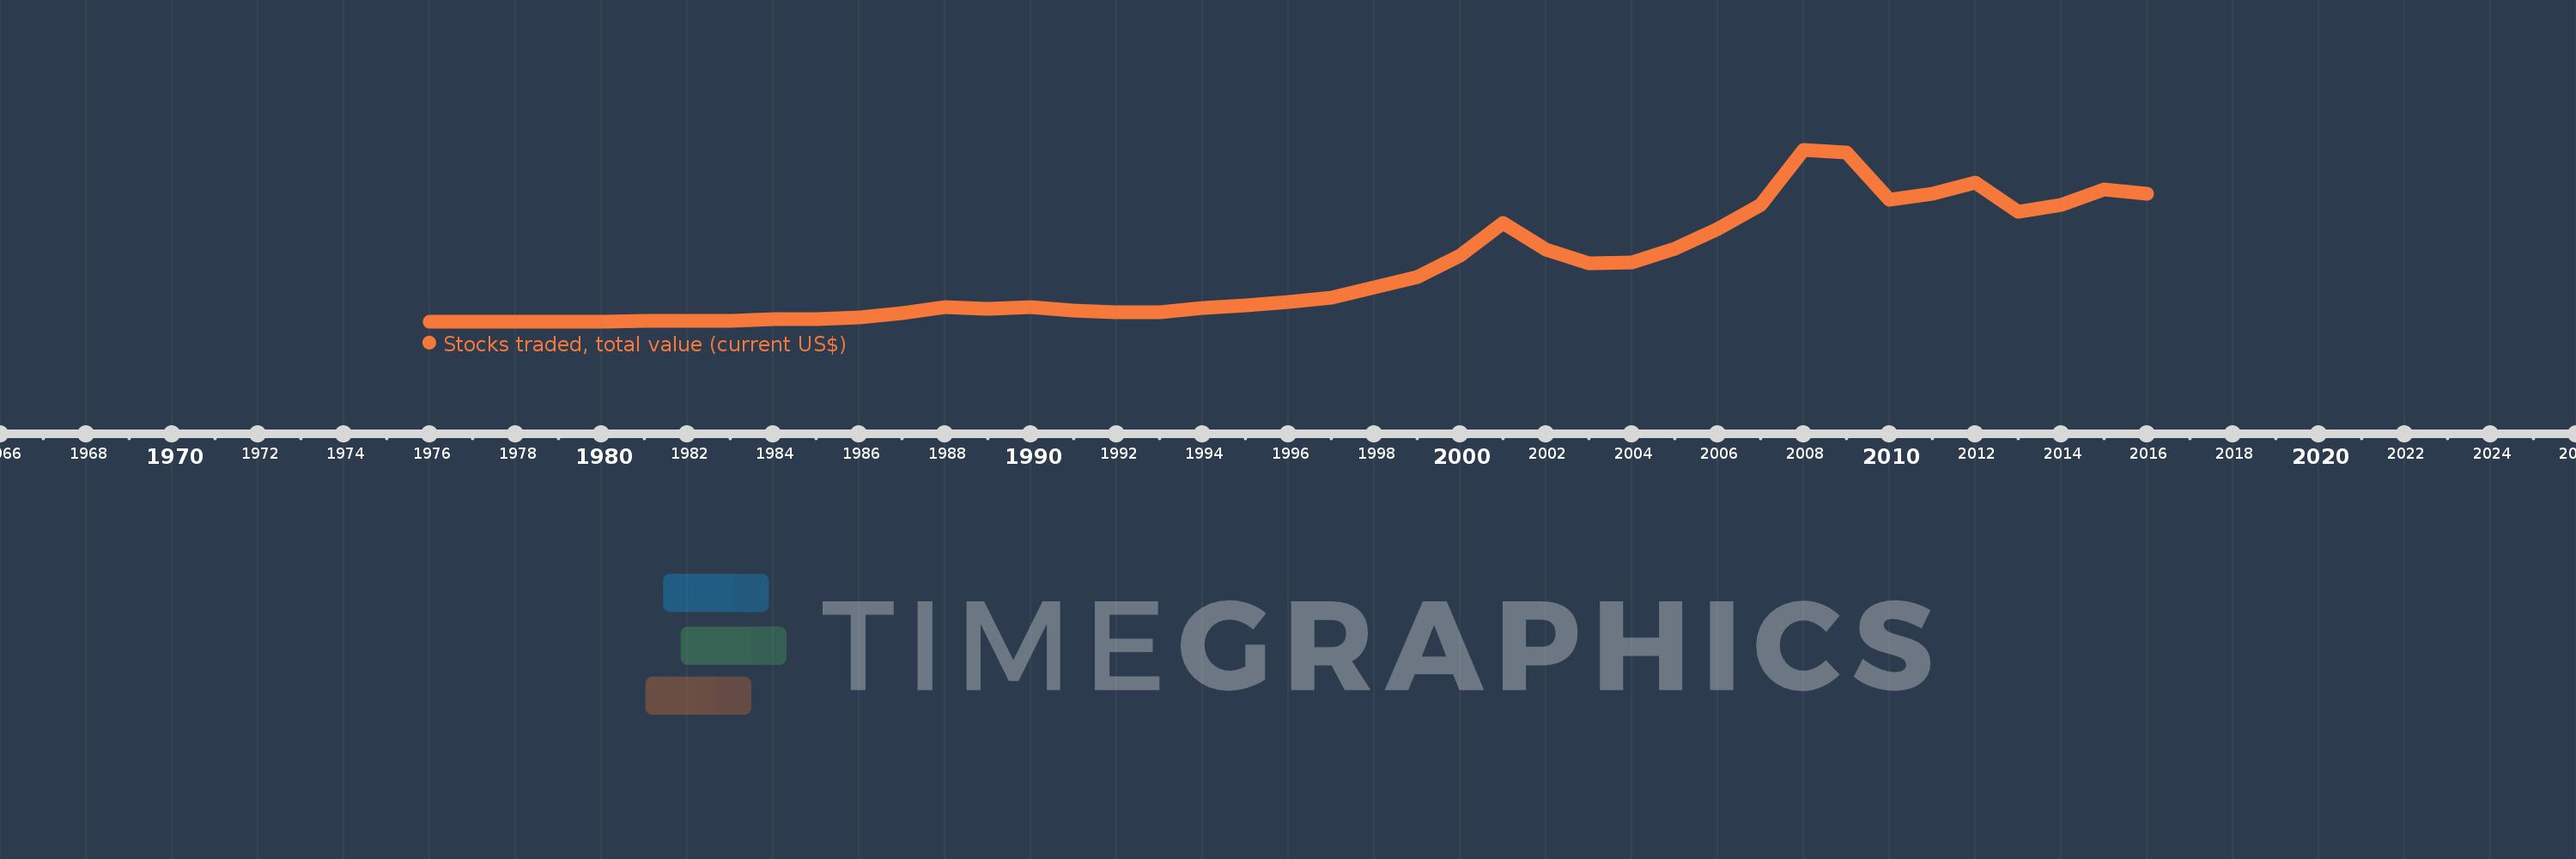
Post-demographic dividend
PST
false
2
1
Stocks traded, total value (current US$)
2016,2015,2014,2013,2012,2011,2010,2009,2008,2007,2006,2005,2004,2003,2002,2001,2000,1999,1998,1997,1996,1995,1994,1993,1992,1991,1990,1989,1988,1987,1986,1985,1984,1983,1982,1981,1980,1979,1978,1977,1976
Estas estadísticas en otros países:
línea de tiempo (timeline):
En esta escala de tiempo se presenta un gráfico de 1976 y 2016 de Post-demographic dividend. Los datos de 1975 están ausentes. El número de observaciones reales por fecha: 41.
Fuente (nombre):
Indicadores del desarrollo mundial
Fuente (organización):
World Federation of Exchanges database.
Categorías:
Financial Sector
Se ha actualizado:
23 abr 2017 año
Los indicadores de los cambios de valor en los últimos años
En promedio:
22.805 billones
Mínimo:
296.57 bn
1 ene 1976 año
Máximo:
75.396 billones
1 ene 2008 año
A la fecha de observación
Valor
Cambio absoluto
El cambio con respecto al valor anterior
1 ene 1976 año
296.57 bn
+296.57 bn
0.0%
1 ene 1977 año
365.679 bn
+69.11 bn
23.3%
1 ene 1978 año
360.425 bn
-5.254 bn
-1.44%
1 ene 1979 año
537.566 bn
+177.141 bn
49.15%
1 ene 1980 año
594.885 bn
+57.319 bn
10.66%
1 ene 1981 año
784.278 bn
+189.394 bn
31.84%
1 ene 1982 año
864.209 bn
+79.931 bn
10.19%
1 ene 1983 año
779.454 bn
-84.755 bn
-9.81%
1 ene 1984 año
1.35 billones
+570.204 bn
73.15%
1 ene 1985 año
1.715 billones
+365.073 bn
27.05%
1 ene 1986 año
2.434 billones
+719.638 bn
41.97%
1 ene 1987 año
4.016 billones
+1.582 billones
64.98%
1 ene 1988 año
6.658 billones
+2.641 billones
65.77%
1 ene 1989 año
5.96 billones
-698.052 bn
-10.48%
1 ene 1990 año
6.663 billones
+703.016 bn
11.8%
1 ene 1991 año
5.433 billones
-1.229 billones
-18.45%
1 ene 1992 año
4.578 billones
-855.146 bn
-15.74%
1 ene 1993 año
4.598 billones
+19.925 bn
0.44%
1 ene 1994 año
6.544 billones
+1.946 billones
42.32%
1 ene 1995 año
7.466 billones
+922.094 bn
14.09%
1 ene 1996 año
9.049 billones
+1.583 billones
21.2%
1 ene 1997 año
11.039 billones
+1.99 billones
21.99%
1 ene 1998 año
15.27 billones
+4.231 billones
38.33%
1 ene 1999 año
19.927 billones
+4.657 billones
30.5%
1 ene 2000 año
29.166 billones
+9.239 billones
46.37%
1 ene 2001 año
43.621 billones
+14.455 billones
49.56%
1 ene 2002 año
31.985 billones
-11.636 billones
-26.68%
1 ene 2003 año
25.851 billones
-6.133 billones
-19.18%
1 ene 2004 año
26.398 billones
+546.173 bn
2.11%
1 ene 2005 año
32.289 billones
+5.891 billones
22.32%
1 ene 2006 año
40.83 billones
+8.541 billones
26.45%
1 ene 2007 año
51.6 billones
+10.77 billones
26.38%
1 ene 2008 año
75.396 billones
+23.795 billones
46.11%
1 ene 2009 año
74.421 billones
-974.824 bn
-1.29%
1 ene 2010 año
53.645 billones
-20.775 billones
-27.92%
1 ene 2011 año
56.304 billones
+2.659 billones
4.96%
1 ene 2012 año
61.287 billones
+4.983 billones
8.85%
1 ene 2013 año
48.645 billones
-12.643 billones
-20.63%
1 ene 2014 año
51.607 billones
+2.963 billones
6.09%
1 ene 2015 año
58.202 billones
+6.595 billones
12.78%
1 ene 2016 año
56.468 billones
-1.734 billones
-2.98%
Ranking de los países por los datos estadísticos actuales


Comentarios: