30
/es/
AIzaSyAYiBZKx7MnpbEhh9jyipgxe19OcubqV5w
April 1, 2024
118455
Czech Republic
CZE
true
2
1
Stocks traded, total value (current US$)
2015,2014,2013,2012,2011,2010,2009,2008,2007,2006,2005,2004,2003,2002,2001,2000,1999,1998,1997,1996,1995,1994
Download
Estadísticas Globales de la Biblioteca →Czech Republic →

Stocks traded, total value (current US$)

Estas estadísticas en otros países:

Arab WorldArgentinaArmeniaAustraliaAustriaBahrainBangladeshBarbadosBelgiumBermudaBoliviaBotswanaBrazilBulgariaCanadaCayman IslandsCentral Europe and the BalticsChannel IslandsChileChinaColombiaCosta RicaCote d'IvoireCroatiaCyprusCzech RepublicDenmarkEarly-demographic dividendEast Asia & PacificEast Asia & Pacific (excluding high income)East Asia & Pacific (IDA & IBRD countries)EcuadorEgypt, Arab Rep.El SalvadorEstoniaEuro areaEurope & Central AsiaEurope & Central Asia (excluding high income)Europe & Central Asia (IDA & IBRD countries)European UnionFijiFinlandFranceGeorgiaGermanyGhanaGreeceGuyanaHigh incomeHong Kong SAR, ChinaHungaryIBRD onlyIcelandIDA & IBRD totalIDA blendIDA totalIndiaIndonesiaIran, Islamic Rep.IrelandIsraelItalyJamaicaJapanJordanKazakhstanKenyaKorea, Rep.KuwaitKyrgyz RepublicLate-demographic dividendLatin America & Caribbean Latin America & Caribbean (excluding high income)Latin America & the Caribbean (IDA & IBRD countries)LatviaLebanonLithuaniaLow & middle incomeLower middle incomeLuxembourgMacedonia, FYRMalawiMalaysiaMaltaMauritiusMexicoMiddle East & North AfricaMiddle East & North Africa (excluding high income)Middle East & North Africa (IDA & IBRD countries)Middle incomeMoldovaMongoliaMontenegroMoroccoNamibiaNetherlandsNew ZealandNigeriaNorth AmericaNorwayOECD membersOmanOther small statesPakistanPanamaPapua New GuineaParaguayPeruPhilippinesPolandPortugalPost-demographic dividendQatarRomaniaRussian FederationSaudi ArabiaSerbiaSeychellesSingaporeSlovak RepublicSloveniaSouth AfricaSouth AsiaSouth Asia (IDA & IBRD)SpainSri LankaSt. Kitts and NevisSub-Saharan Africa Sub-Saharan Africa (excluding high income)Sub-Saharan Africa (IDA & IBRD countries)SwazilandSwedenSwitzerlandTanzaniaThailandTrinidad and TobagoTunisiaTurkeyUgandaUkraineUnited Arab EmiratesUnited KingdomUnited StatesUpper middle incomeUruguayUzbekistanVenezuela, RBVietnamWest Bank and GazaWorldZambiaZimbabwe

línea de tiempo (timeline):

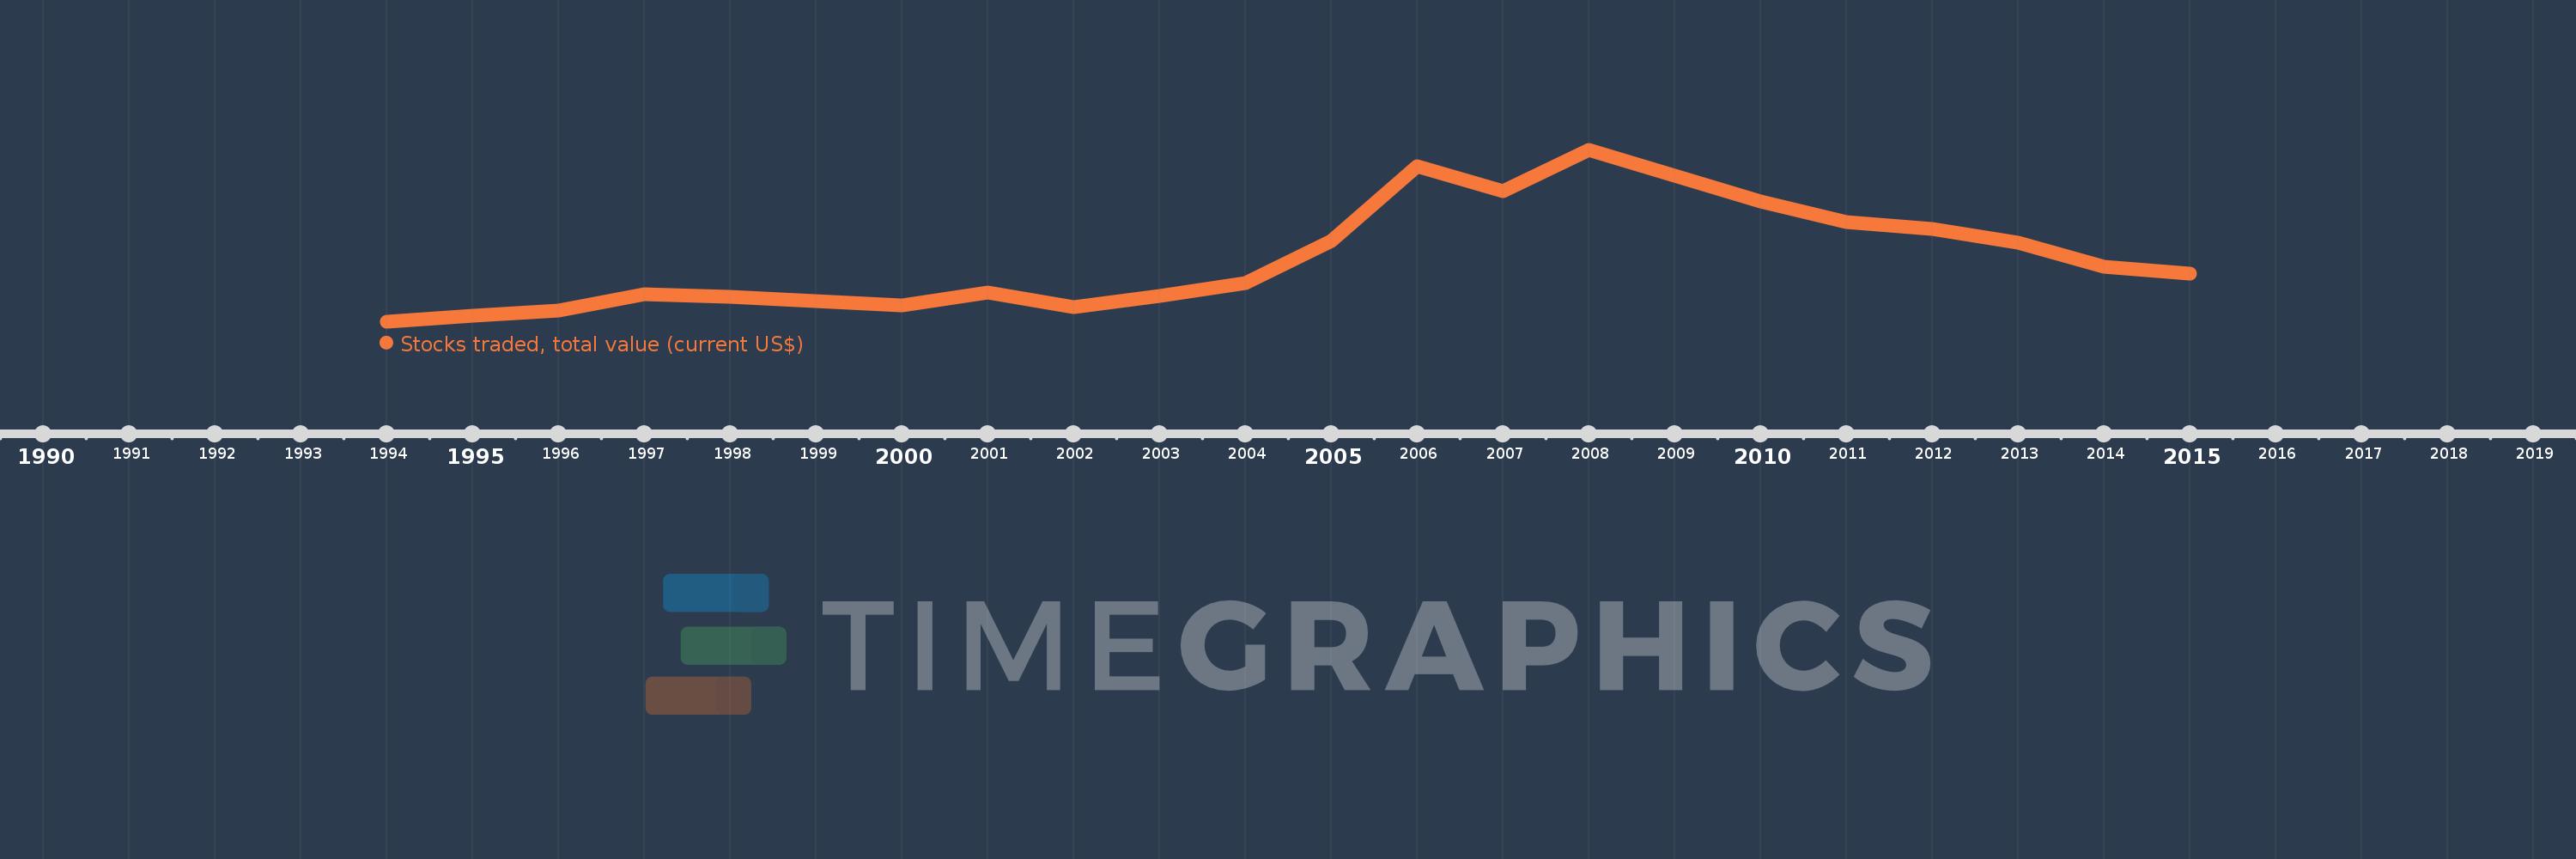
En esta escala de tiempo se presenta un gráfico de 1994 y 2015 de Czech Republic. Los datos de 1993 están ausentes. El número de observaciones reales por fecha: 22.

Fuente (nombre):

Indicadores del desarrollo mundial

Fuente (organización):

World Federation of Exchanges database.

Categorías:

Financial Sector

Se ha actualizado:

23 abr 2017 año

Los indicadores de los cambios de valor en los últimos años

En promedio:
14.141 bn
Mínimo:
237.5 millones
1 ene 1994 año
Máximo:
37.789 bn
1 ene 2008 año
A la fecha de observación
Valor
Cambio absoluto
El cambio con respecto al valor anterior
1 ene 1994 año
237.5 millones
+237.5 millones
0.0%
1 ene 1995 año
1.527 bn
+1.29 bn
543.07%
1 ene 1996 año
2.745 bn
+1.218 bn
79.72%
1 ene 1997 año
6.33 bn
+3.585 bn
130.6%
1 ene 1998 año
5.712 bn
-617.29 millones
-9.75%
1 ene 1999 año
4.726 bn
-986.7 millones
-17.27%
1 ene 2000 año
3.934 bn
-791.9 millones
-16.76%
1 ene 2001 año
6.65 bn
+2.716 bn
69.05%
1 ene 2002 año
3.448 bn
-3.202 bn
-48.15%
1 ene 2003 año
5.922 bn
+2.474 bn
71.75%
1 ene 2004 año
8.768 bn
+2.846 bn
48.06%
1 ene 2005 año
18.01 bn
+9.242 bn
105.4%
1 ene 2006 año
34.34 bn
+16.33 bn
90.67%
1 ene 2007 año
28.779 bn
-5.562 bn
-16.2%
1 ene 2008 año
37.789 bn
+9.01 bn
31.31%
1 ene 2009 año
32.281 bn
-5.508 bn
-14.58%
1 ene 2010 año
26.637 bn
-5.644 bn
-17.48%
1 ene 2011 año
22.077 bn
-4.56 bn
-17.12%
1 ene 2012 año
20.608 bn
-1.469 bn
-6.65%
1 ene 2013 año
17.535 bn
-3.073 bn
-14.91%
1 ene 2014 año
12.269 bn
-5.266 bn
-30.03%
1 ene 2015 año
10.777 bn
-1.492 bn
-12.16%

Ranking de los países por los datos estadísticos actuales