30
/de/
AIzaSyAYiBZKx7MnpbEhh9jyipgxe19OcubqV5w
April 1, 2024
75408
Azerbaijan
AZE
true
2
1
Net official flows from UN agencies, IFAD (current US$)
2015,2014,2013,2012,2011,2010,2009,2008,2007,2006,2005,2004,2003,2002,2001,2000,1999
Download
Bibliothek der Globalstatistik →Azerbaijan →

Net official flows from UN agencies, IFAD (current US$)

Diese Statistik in anderen Ländern:

AfghanistanAlbaniaAlgeriaAngolaArab WorldArgentinaArmeniaAzerbaijanBangladeshBelizeBeninBhutanBoliviaBosnia and HerzegovinaBotswanaBrazilBurkina FasoBurundiCabo VerdeCambodiaCameroonCaribbean small statesCentral African RepublicCentral Europe and the BalticsChadChileChinaColombiaComorosCongo, Dem. Rep.Congo, Rep.Costa RicaCote d'IvoireCubaCyprusDjiboutiDominicaDominican RepublicEast Asia & PacificEast Asia & Pacific (excluding high income)East Asia & Pacific (IDA & IBRD countries)EcuadorEgypt, Arab Rep.El SalvadorEquatorial GuineaEritreaEthiopiaEuro areaEurope & Central AsiaEurope & Central Asia (excluding high income)Europe & Central Asia (IDA & IBRD countries)European UnionFragile and conflict affected situationsGabonGambia, TheGeorgiaGhanaGrenadaGuatemalaGuineaGuinea-BissauGuyanaHaitiHeavily indebted poor countries (HIPC)High incomeHondurasIBRD onlyIDA & IBRD totalIDA blendIDA onlyIDA totalIndiaIndonesiaIraqJamaicaJordanKenyaKorea, Dem. People’s Rep.Kyrgyz RepublicLao PDRLatin America & Caribbean Latin America & Caribbean (excluding high income)Latin America & the Caribbean (IDA & IBRD countries)Least developed countries: UN classificationLebanonLesothoLiberiaLow incomeLower middle incomeMacao SAR, ChinaMacedonia, FYRMadagascarMalawiMaldivesMaliMauritaniaMauritiusMexicoMiddle East & North AfricaMiddle East & North Africa (excluding high income)Middle East & North Africa (IDA & IBRD countries)MoldovaMongoliaMoroccoMozambiqueMyanmarNamibiaNepalNicaraguaNigerNigeriaOECD membersOther small statesPacific island small statesPakistanPanamaPapua New GuineaParaguayPeruPhilippinesRomaniaRwandaSamoaSao Tome and PrincipeSenegalSeychellesSierra LeoneSmall statesSolomon IslandsSomaliaSouth AsiaSouth Asia (IDA & IBRD)South SudanSri LankaSt. LuciaSt. Vincent and the GrenadinesSub-Saharan Africa Sub-Saharan Africa (excluding high income)Sub-Saharan Africa (IDA & IBRD countries)SudanSurinameSwazilandSyrian Arab RepublicTajikistanTanzaniaThailandTimor-LesteTogoTongaTunisiaTurkeyUgandaUpper middle incomeUruguayUzbekistanVenezuela, RBVietnamWest Bank and GazaWorldYemen, Rep.ZambiaZimbabwe

Zeitlinie:

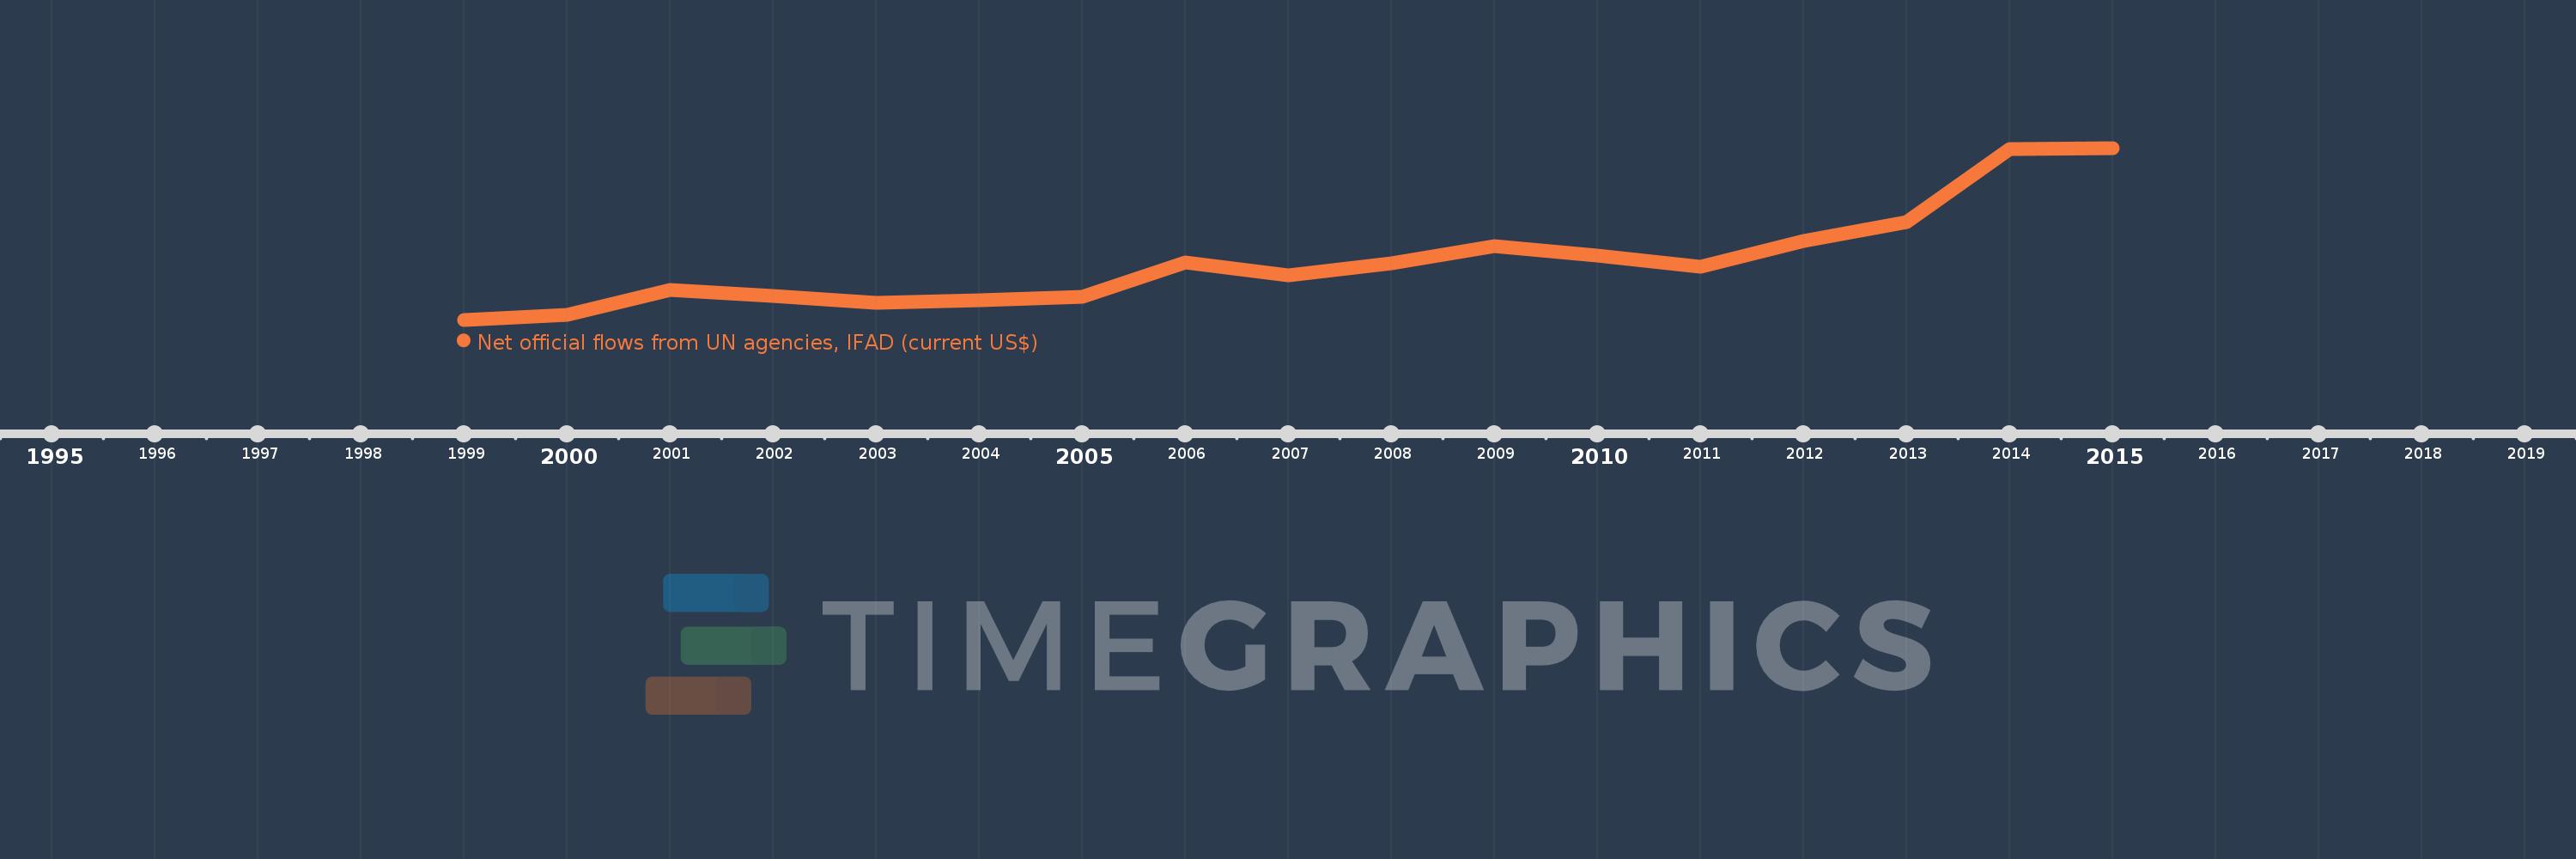
Diese Zeitleiste vorliegt die Graphik ab 1999 J. bis 2015 J. Azerbaijan. Die Angaben bis 1998 J. sind nicht vorhanden. Die Zahl aktueller Beobachtungen nach Daten: 17.

Die Quelle (Bezeichnung):

Kennzahlen der Weltentwicklung

Die Quelle (Einrichtung):

Development Assistance Committee of the Organisation for Economic Co-operation and Development, Geographical Distribution of Financial Flows to Developing Countries, Development Co-operation Report, and International Development Statistics database. Data are available online at: www.oecd.org/dac/stats/idsonline.

Kategorien:

Aid Effectiveness

Es wurde aktualisiert:

23 Apr 2017 Jahr

Kennzahlen der Wertänderungen vom Jahr zum Jahr

im Durchschnitt:
3.304 Mln.
Minimum:
1000.0 Tsnd.
1 Jan 1999 Jahr
Maximum:
7.83 Mln.
1 Jan 2015 Jahr
Zum Datum der Beobachtung
Wert
Absolute Veränderung
Die Veränderung bezüglich dem vorherigen Wert
1 Jan 1999 Jahr
1000.0 Tsnd.
+1000.0 Tsnd.
0.0%
1 Jan 2000 Jahr
1.18 Mln.
+180.0 Tsnd.
18.0%
1 Jan 2001 Jahr
2.19 Mln.
+1.01 Mln.
85.59%
1 Jan 2002 Jahr
1.95 Mln.
-240.0 Tsnd.
-10.96%
1 Jan 2003 Jahr
1.66 Mln.
-290.0 Tsnd.
-14.87%
1 Jan 2004 Jahr
1.79 Mln.
+130.0 Tsnd.
7.83%
1 Jan 2005 Jahr
1.91 Mln.
+120.0 Tsnd.
6.7%
1 Jan 2006 Jahr
3.29 Mln.
+1.38 Mln.
72.25%
1 Jan 2007 Jahr
2.75 Mln.
-540.0 Tsnd.
-16.41%
1 Jan 2008 Jahr
3.24 Mln.
+490.0 Tsnd.
17.82%
1 Jan 2009 Jahr
3.92 Mln.
+680.0 Tsnd.
20.99%
1 Jan 2010 Jahr
3.55 Mln.
-370.0 Tsnd.
-9.44%
1 Jan 2011 Jahr
3.1 Mln.
-450.0 Tsnd.
-12.68%
1 Jan 2012 Jahr
4.13 Mln.
+1.03 Mln.
33.23%
1 Jan 2013 Jahr
4.87 Mln.
+740.0 Tsnd.
17.92%
1 Jan 2014 Jahr
7.8 Mln.
+2.93 Mln.
60.16%
1 Jan 2015 Jahr
7.83 Mln.
+30.0 Tsnd.
0.38%

Bewertung der Länder gemäß mit laufender Statistik nach Jahren