29
/de/
de
AIzaSyAYiBZKx7MnpbEhh9jyipgxe19OcubqV5w
April 1, 2024
44515
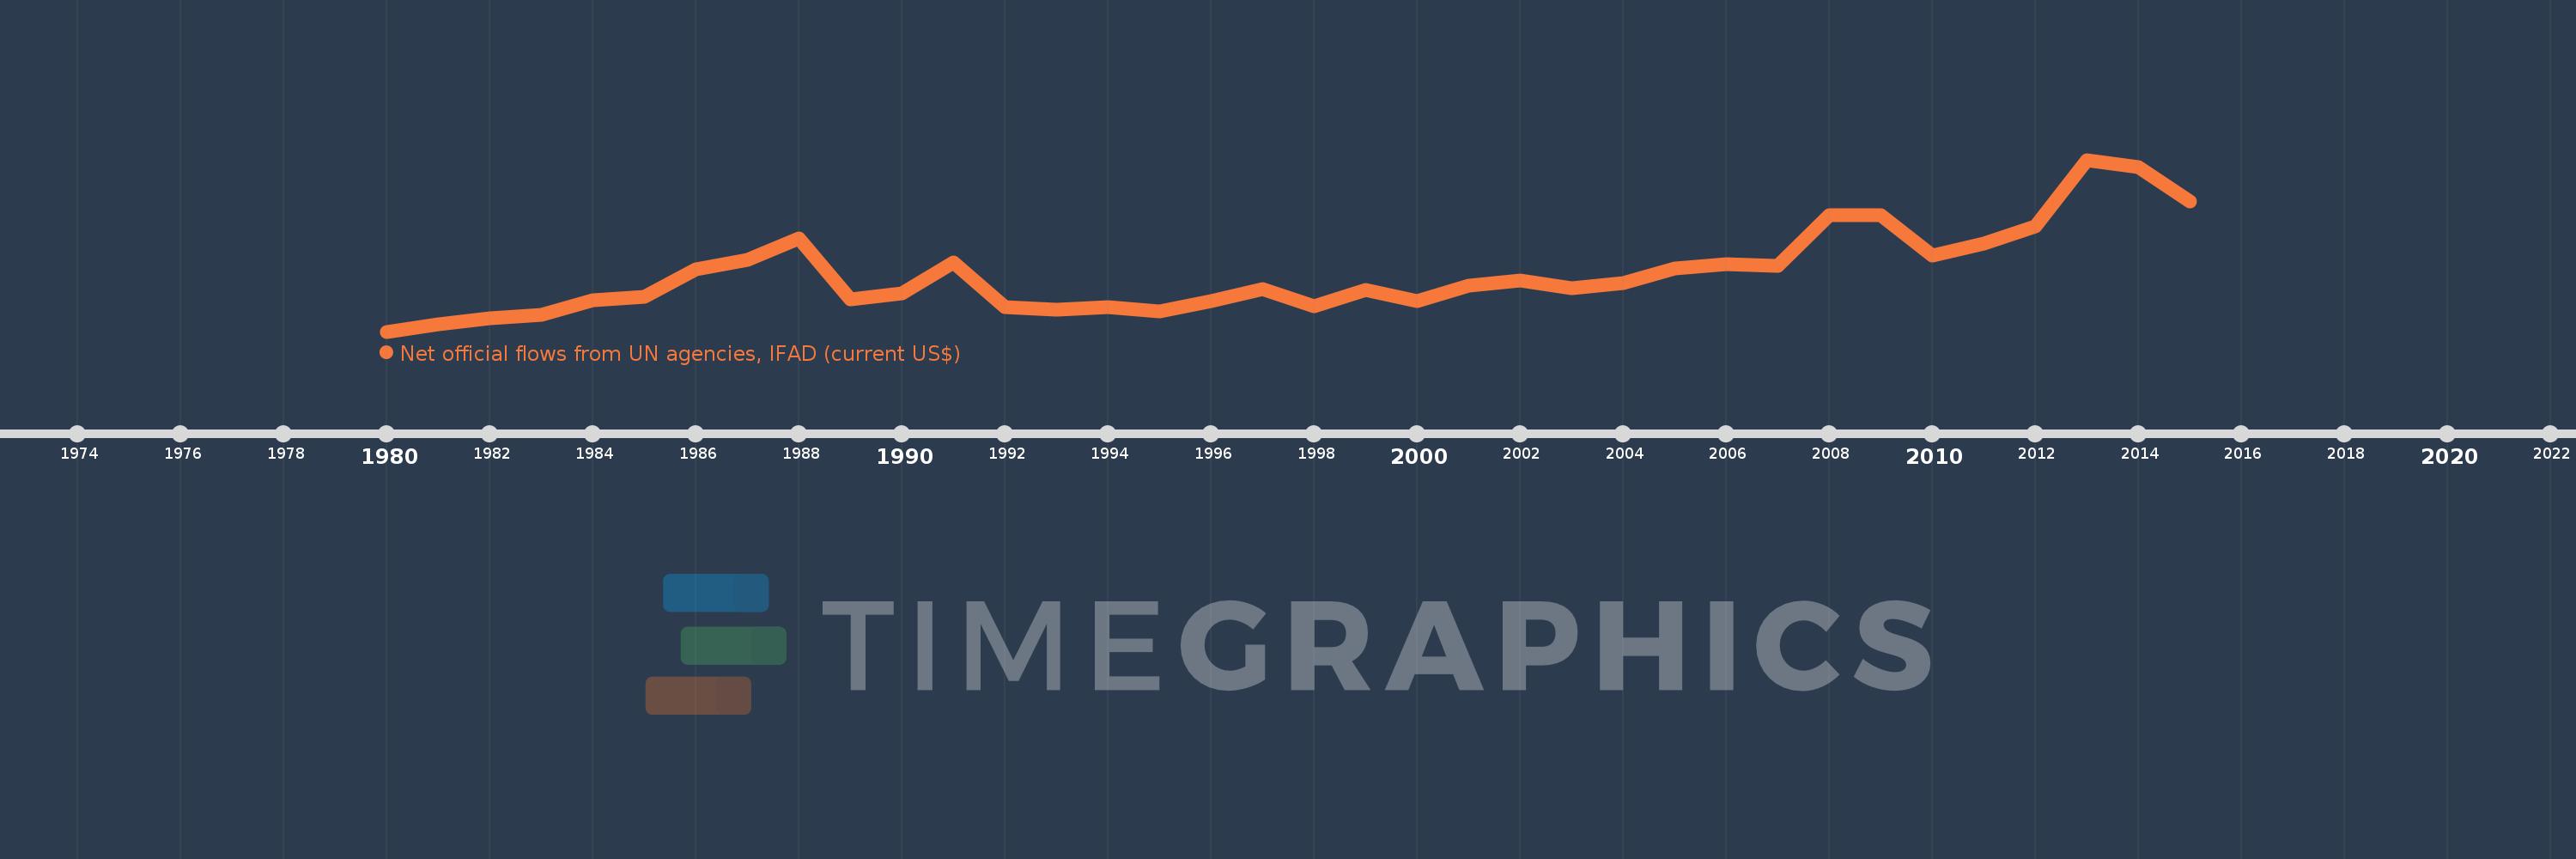
Least developed countries: UN classification
LDC
false
2
1
Net official flows from UN agencies, IFAD (current US$)
2015,2014,2013,2012,2011,2010,2009,2008,2007,2006,2005,2004,2003,2002,2001,2000,1999,1998,1997,1996,1995,1994,1993,1992,1991,1990,1989,1988,1987,1986,1985,1984,1983,1982,1981,1980
Diese Statistik in anderen Ländern:
Zeitlinie:
Diese Zeitleiste vorliegt die Graphik ab 1980 J. bis 2015 J. Least developed countries: UN classification. Die Angaben bis 1979 J. sind nicht vorhanden. Die Zahl aktueller Beobachtungen nach Daten: 36.
Die Quelle (Bezeichnung):
Kennzahlen der Weltentwicklung
Die Quelle (Einrichtung):
Development Assistance Committee of the Organisation for Economic Co-operation and Development, Geographical Distribution of Financial Flows to Developing Countries, Development Co-operation Report, and International Development Statistics database. Data are available online at: www.oecd.org/dac/stats/idsonline.
Kategorien:
Aid Effectiveness
Es wurde aktualisiert:
23 Apr 2017 Jahr
Kennzahlen der Wertänderungen vom Jahr zum Jahr
im Durchschnitt:
100.434 Mln.
Minimum:
1.1 Mln.
1 Jan 1980 Jahr
Maximum:
295.58 Mln.
1 Jan 2013 Jahr
Zum Datum der Beobachtung
Wert
Absolute Veränderung
Die Veränderung bezüglich dem vorherigen Wert
1 Jan 1980 Jahr
1.1 Mln.
+1.1 Mln.
0.0%
1 Jan 1981 Jahr
12.92 Mln.
+11.82 Mln.
1.07 Tsnd.%
1 Jan 1982 Jahr
24.45 Mln.
+11.53 Mln.
89.24%
1 Jan 1983 Jahr
29.51 Mln.
+5.06 Mln.
20.7%
1 Jan 1984 Jahr
55.52 Mln.
+26.01 Mln.
88.14%
1 Jan 1985 Jahr
61.23 Mln.
+5.71 Mln.
10.28%
1 Jan 1986 Jahr
107.48 Mln.
+46.25 Mln.
75.53%
1 Jan 1987 Jahr
124.66 Mln.
+17.18 Mln.
15.98%
1 Jan 1988 Jahr
160.21 Mln.
+35.55 Mln.
28.52%
1 Jan 1989 Jahr
56.85 Mln.
-103.36 Mln.
-64.52%
1 Jan 1990 Jahr
66.37 Mln.
+9.52 Mln.
16.75%
1 Jan 1991 Jahr
120.11 Mln.
+53.74 Mln.
80.97%
1 Jan 1992 Jahr
43.22 Mln.
-76.89 Mln.
-64.02%
1 Jan 1993 Jahr
39.12 Mln.
-4.1 Mln.
-9.49%
1 Jan 1994 Jahr
43.74 Mln.
+4.62 Mln.
11.81%
1 Jan 1995 Jahr
35.83 Mln.
-7.91 Mln.
-18.08%
1 Jan 1996 Jahr
53.22 Mln.
+17.39 Mln.
48.53%
1 Jan 1997 Jahr
74.23 Mln.
+21.01 Mln.
39.48%
1 Jan 1998 Jahr
44.64 Mln.
-29.59 Mln.
-39.86%
1 Jan 1999 Jahr
72.05 Mln.
+27.41 Mln.
61.4%
1 Jan 2000 Jahr
53.38 Mln.
-18.67 Mln.
-25.91%
1 Jan 2001 Jahr
79.77 Mln.
+26.39 Mln.
49.44%
1 Jan 2002 Jahr
88.34 Mln.
+8.57 Mln.
10.74%
1 Jan 2003 Jahr
75.66 Mln.
-12.68 Mln.
-14.35%
1 Jan 2004 Jahr
84.83 Mln.
+9.17 Mln.
12.12%
1 Jan 2005 Jahr
108.89 Mln.
+24.06 Mln.
28.36%
1 Jan 2006 Jahr
116.19 Mln.
+7.3 Mln.
6.7%
1 Jan 2007 Jahr
113.06 Mln.
-3.13 Mln.
-2.69%
1 Jan 2008 Jahr
200.91 Mln.
+87.85 Mln.
77.7%
1 Jan 2009 Jahr
200.79 Mln.
-120.0 Tsnd.
-0.06%
1 Jan 2010 Jahr
131.03 Mln.
-69.76 Mln.
-34.74%
1 Jan 2011 Jahr
152.2 Mln.
+21.17 Mln.
16.16%
1 Jan 2012 Jahr
181.04 Mln.
+28.84 Mln.
18.95%
1 Jan 2013 Jahr
295.58 Mln.
+114.54 Mln.
63.27%
1 Jan 2014 Jahr
283.0 Mln.
-12.58 Mln.
-4.26%
1 Jan 2015 Jahr
224.51 Mln.
-58.49 Mln.
-20.67%
Bewertung der Länder gemäß mit laufender Statistik nach Jahren


Kommentare: