29
/de/
de
AIzaSyAYiBZKx7MnpbEhh9jyipgxe19OcubqV5w
April 1, 2024
251120
St. Lucia
LCA
true
2
1
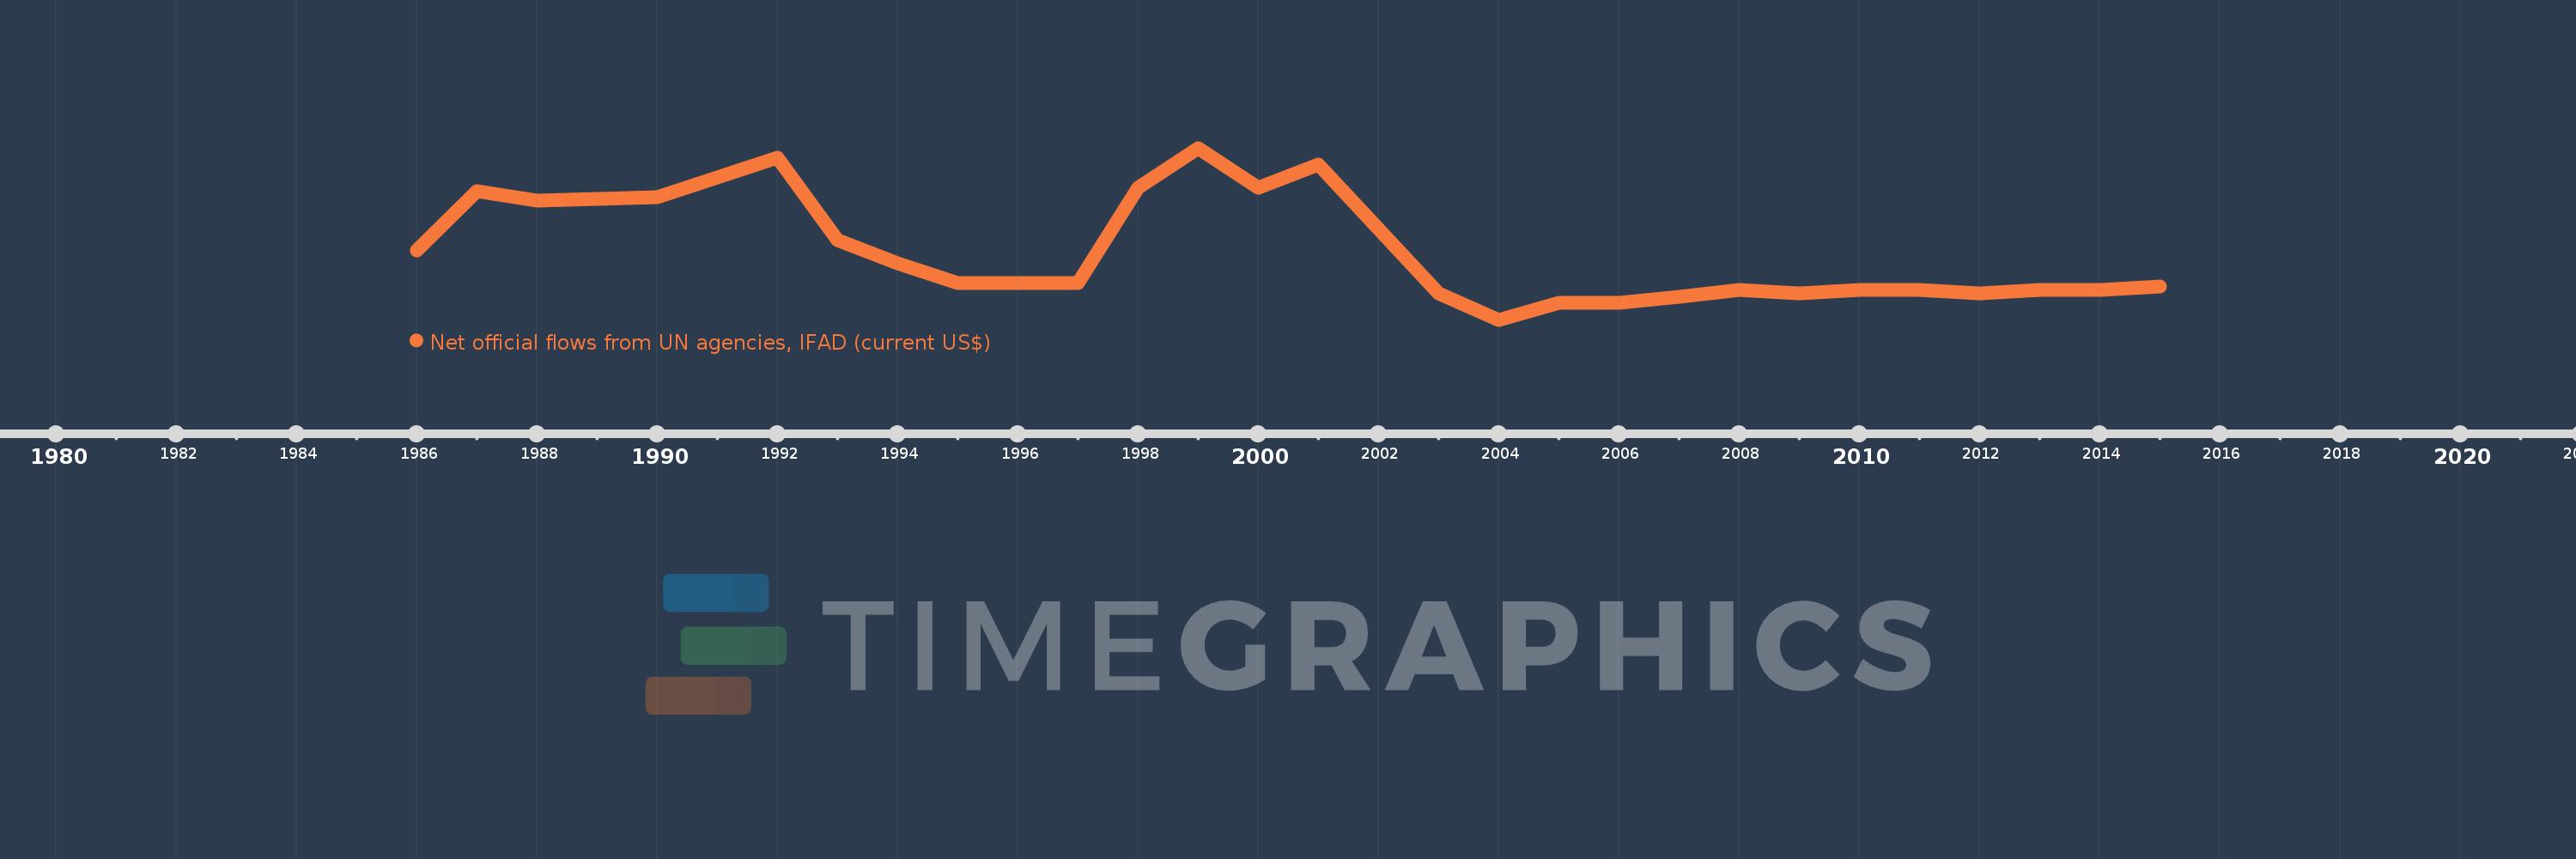
Net official flows from UN agencies, IFAD (current US$)
2015,2014,2013,2012,2011,2010,2009,2008,2007,2006,2005,2004,2003,2001,2000,1999,1998,1997,1996,1995,1994,1993,1992,1990,1988,1987,1986
Diese Statistik in anderen Ländern:
Zeitlinie:
Diese Zeitleiste vorliegt die Graphik ab 1986 J. bis 2015 J. St. Lucia. Die Angaben bis 1985 J. sind nicht vorhanden. Die Zahl aktueller Beobachtungen nach Daten: 27.
Die Quelle (Bezeichnung):
Kennzahlen der Weltentwicklung
Die Quelle (Einrichtung):
Development Assistance Committee of the Organisation for Economic Co-operation and Development, Geographical Distribution of Financial Flows to Developing Countries, Development Co-operation Report, and International Development Statistics database. Data are available online at: www.oecd.org/dac/stats/idsonline.
Kategorien:
Aid Effectiveness
Es wurde aktualisiert:
23 Apr 2017 Jahr
Kennzahlen der Wertänderungen vom Jahr zum Jahr
im Durchschnitt:
-3.333 Tsnd.
Minimum:
-200.0 Tsnd.
1 Jan 2004 Jahr
Maximum:
320.0 Tsnd.
1 Jan 1999 Jahr
Zum Datum der Beobachtung
Wert
Absolute Veränderung
Die Veränderung bezüglich dem vorherigen Wert
1 Jan 1986 Jahr
10.0 Tsnd.
+10.0 Tsnd.
0.0%
1 Jan 1987 Jahr
190.0 Tsnd.
+180.0 Tsnd.
1.8 Tsnd.%
1 Jan 1988 Jahr
160.0 Tsnd.
-30.0 Tsnd.
-15.79%
1 Jan 1990 Jahr
170.0 Tsnd.
+10.0 Tsnd.
6.25%
1 Jan 1992 Jahr
290.0 Tsnd.
+120.0 Tsnd.
70.59%
1 Jan 1993 Jahr
40.0 Tsnd.
-250.0 Tsnd.
-86.21%
1 Jan 1994 Jahr
-30.0 Tsnd.
-70.0 Tsnd.
-175.0%
1 Jan 1995 Jahr
-90.0 Tsnd.
-60.0 Tsnd.
200.0%
1 Jan 1996 Jahr
-90.0 Tsnd.
0.0
0.0%
1 Jan 1997 Jahr
-90.0 Tsnd.
0.0
0.0%
1 Jan 1998 Jahr
200.0 Tsnd.
+290.0 Tsnd.
-322.22%
1 Jan 1999 Jahr
320.0 Tsnd.
+120.0 Tsnd.
60.0%
1 Jan 2000 Jahr
200.0 Tsnd.
-120.0 Tsnd.
-37.5%
1 Jan 2001 Jahr
270.0 Tsnd.
+70.0 Tsnd.
35.0%
1 Jan 2003 Jahr
-120.0 Tsnd.
-390.0 Tsnd.
-144.44%
1 Jan 2004 Jahr
-200.0 Tsnd.
-80.0 Tsnd.
66.67%
1 Jan 2005 Jahr
-150.0 Tsnd.
+50.0 Tsnd.
-25.0%
1 Jan 2006 Jahr
-150.0 Tsnd.
0.0
0.0%
1 Jan 2007 Jahr
-130.0 Tsnd.
+20.0 Tsnd.
-13.33%
1 Jan 2008 Jahr
-110.0 Tsnd.
+20.0 Tsnd.
-15.38%
1 Jan 2009 Jahr
-120.0 Tsnd.
-10.0 Tsnd.
9.09%
1 Jan 2010 Jahr
-110.0 Tsnd.
+10.0 Tsnd.
-8.33%
1 Jan 2011 Jahr
-110.0 Tsnd.
0.0
0.0%
1 Jan 2012 Jahr
-120.0 Tsnd.
-10.0 Tsnd.
9.09%
1 Jan 2013 Jahr
-110.0 Tsnd.
+10.0 Tsnd.
-8.33%
1 Jan 2014 Jahr
-110.0 Tsnd.
0.0
0.0%
1 Jan 2015 Jahr
-100.0 Tsnd.
+10.0 Tsnd.
-9.09%
Bewertung der Länder gemäß mit laufender Statistik nach Jahren


Kommentare: