29
/de/
de
AIzaSyAYiBZKx7MnpbEhh9jyipgxe19OcubqV5w
April 1, 2024
30979
Europe & Central Asia
ECS
false
2
1
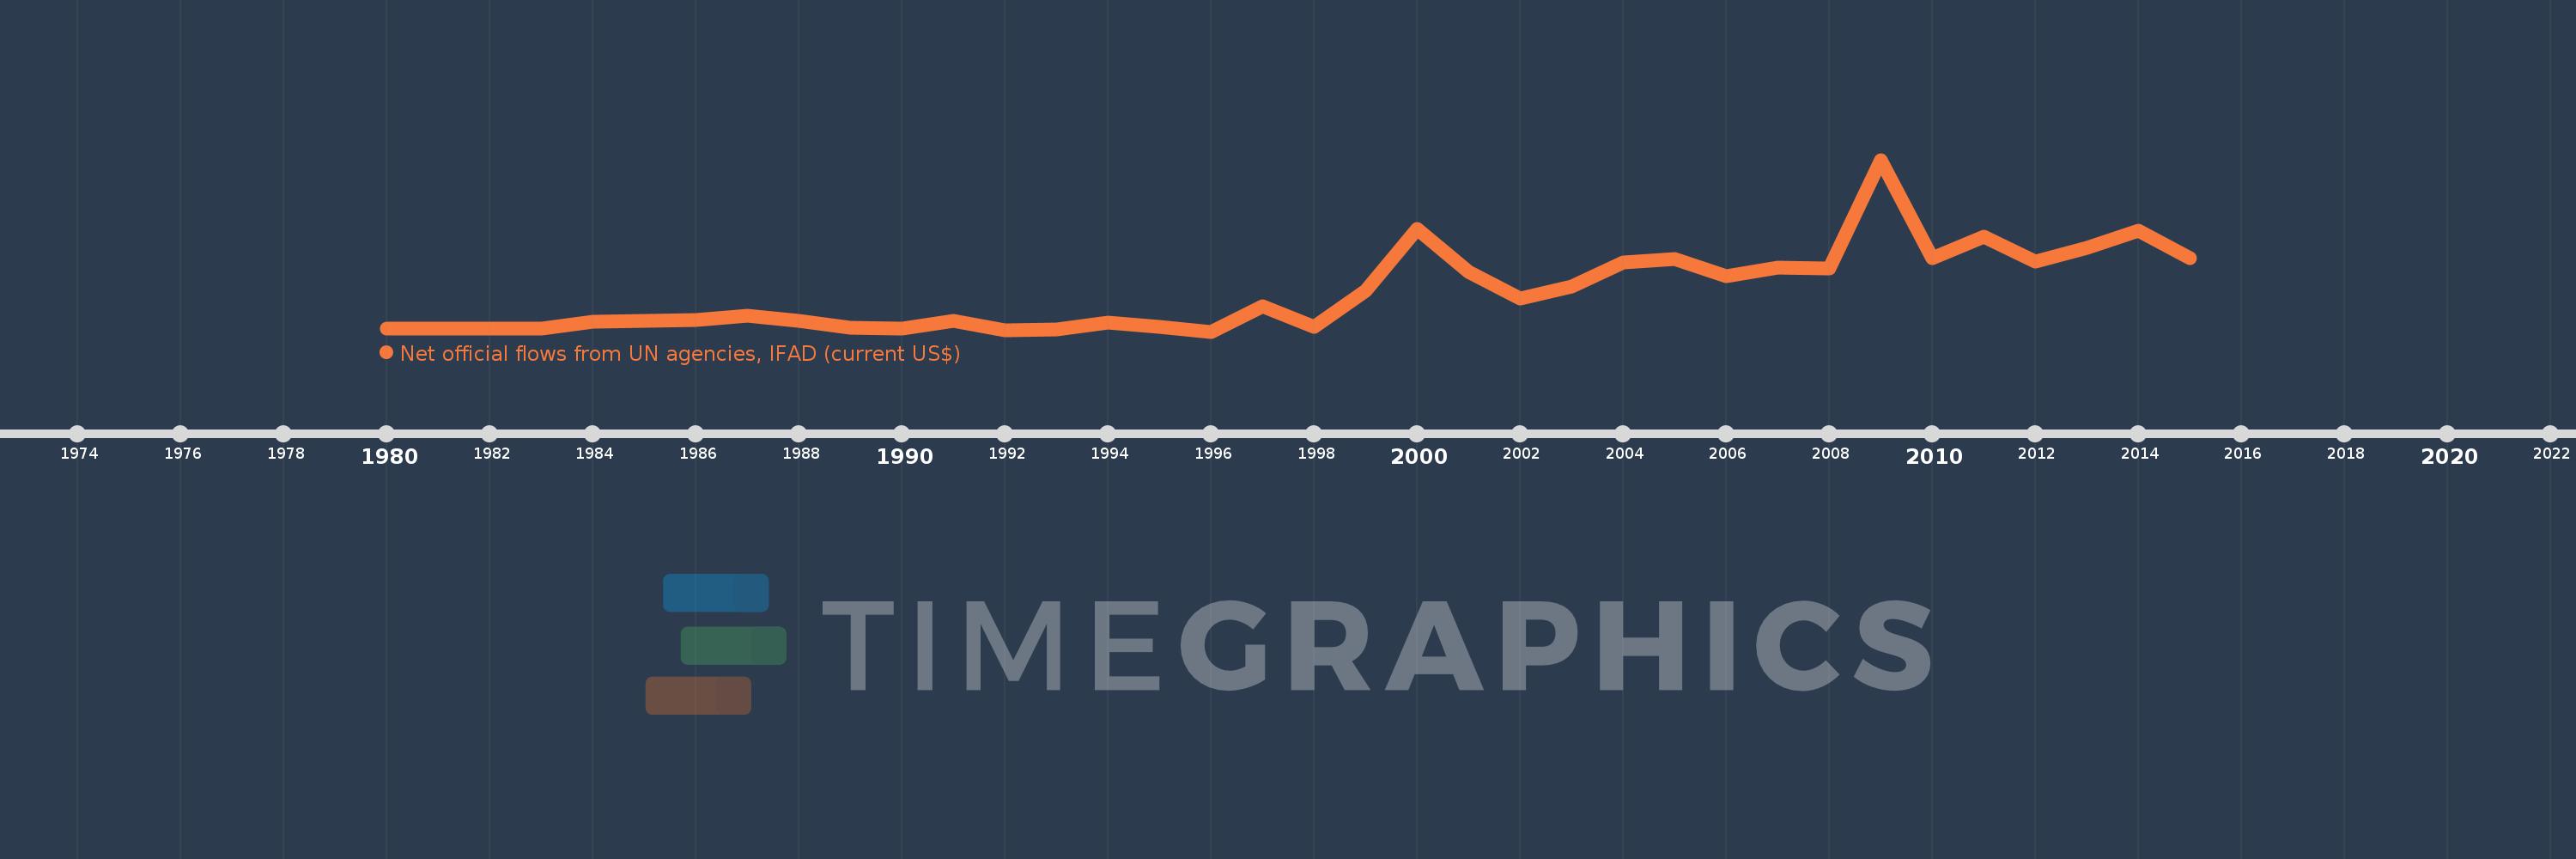
Net official flows from UN agencies, IFAD (current US$)
2015,2014,2013,2012,2011,2010,2009,2008,2007,2006,2005,2004,2003,2002,2001,2000,1999,1998,1997,1996,1995,1994,1993,1992,1991,1990,1989,1988,1987,1986,1985,1984,1983,1982,1981,1980
Diese Statistik in anderen Ländern:
Zeitlinie:
Diese Zeitleiste vorliegt die Graphik ab 1980 J. bis 2015 J. Europe & Central Asia. Die Angaben bis 1979 J. sind nicht vorhanden. Die Zahl aktueller Beobachtungen nach Daten: 36.
Die Quelle (Bezeichnung):
Kennzahlen der Weltentwicklung
Die Quelle (Einrichtung):
Development Assistance Committee of the Organisation for Economic Co-operation and Development, Geographical Distribution of Financial Flows to Developing Countries, Development Co-operation Report, and International Development Statistics database. Data are available online at: www.oecd.org/dac/stats/idsonline.
Kategorien:
Aid Effectiveness
Es wurde aktualisiert:
23 Apr 2017 Jahr
Kennzahlen der Wertänderungen vom Jahr zum Jahr
im Durchschnitt:
10.991 Mln.
Minimum:
-960.0 Tsnd.
1 Jan 1996 Jahr
Maximum:
51.51 Mln.
1 Jan 2009 Jahr
Zum Datum der Beobachtung
Wert
Absolute Veränderung
Die Veränderung bezüglich dem vorherigen Wert
1 Jan 1980 Jahr
0.0
0.0
0.0%
1 Jan 1984 Jahr
1.98 Mln.
+1.98 Mln.
%
1 Jan 1985 Jahr
2.29 Mln.
+310.0 Tsnd.
15.66%
1 Jan 1986 Jahr
2.49 Mln.
+200.0 Tsnd.
8.73%
1 Jan 1987 Jahr
3.81 Mln.
+1.32 Mln.
53.01%
1 Jan 1988 Jahr
2.45 Mln.
-1.36 Mln.
-35.7%
1 Jan 1989 Jahr
240.0 Tsnd.
-2.21 Mln.
-90.2%
1 Jan 1990 Jahr
0.0
-240.0 Tsnd.
-100.0%
1 Jan 1991 Jahr
2.24 Mln.
+2.24 Mln.
%
1 Jan 1992 Jahr
-690.0 Tsnd.
-2.93 Mln.
-130.8%
1 Jan 1993 Jahr
-240.0 Tsnd.
+450.0 Tsnd.
-65.22%
1 Jan 1994 Jahr
1.75 Mln.
+1.99 Mln.
-829.17%
1 Jan 1995 Jahr
400.0 Tsnd.
-1.35 Mln.
-77.14%
1 Jan 1996 Jahr
-960.0 Tsnd.
-1.36 Mln.
-340.0%
1 Jan 1997 Jahr
6.67 Mln.
+7.63 Mln.
-794.79%
1 Jan 1998 Jahr
480.0 Tsnd.
-6.19 Mln.
-92.8%
1 Jan 1999 Jahr
11.51 Mln.
+11.03 Mln.
2.3 Tsnd.%
1 Jan 2000 Jahr
30.28 Mln.
+18.77 Mln.
163.08%
1 Jan 2001 Jahr
17.28 Mln.
-13.0 Mln.
-42.93%
1 Jan 2002 Jahr
9.15 Mln.
-8.13 Mln.
-47.05%
1 Jan 2003 Jahr
12.93 Mln.
+3.78 Mln.
41.31%
1 Jan 2004 Jahr
20.15 Mln.
+7.22 Mln.
55.84%
1 Jan 2005 Jahr
21.1 Mln.
+950.0 Tsnd.
4.71%
1 Jan 2006 Jahr
15.98 Mln.
-5.12 Mln.
-24.27%
1 Jan 2007 Jahr
18.58 Mln.
+2.6 Mln.
16.27%
1 Jan 2008 Jahr
18.44 Mln.
-140.0 Tsnd.
-0.75%
1 Jan 2009 Jahr
51.51 Mln.
+33.07 Mln.
179.34%
1 Jan 2010 Jahr
21.5 Mln.
-30.01 Mln.
-58.26%
1 Jan 2011 Jahr
28.03 Mln.
+6.53 Mln.
30.37%
1 Jan 2012 Jahr
20.42 Mln.
-7.61 Mln.
-27.15%
1 Jan 2013 Jahr
24.62 Mln.
+4.2 Mln.
20.57%
1 Jan 2014 Jahr
29.93 Mln.
+5.31 Mln.
21.57%
1 Jan 2015 Jahr
21.34 Mln.
-8.59 Mln.
-28.7%
Bewertung der Länder gemäß mit laufender Statistik nach Jahren


Kommentare: