29
/de/
de
AIzaSyAYiBZKx7MnpbEhh9jyipgxe19OcubqV5w
April 1, 2024
65123
Albania
ALB
true
2
1
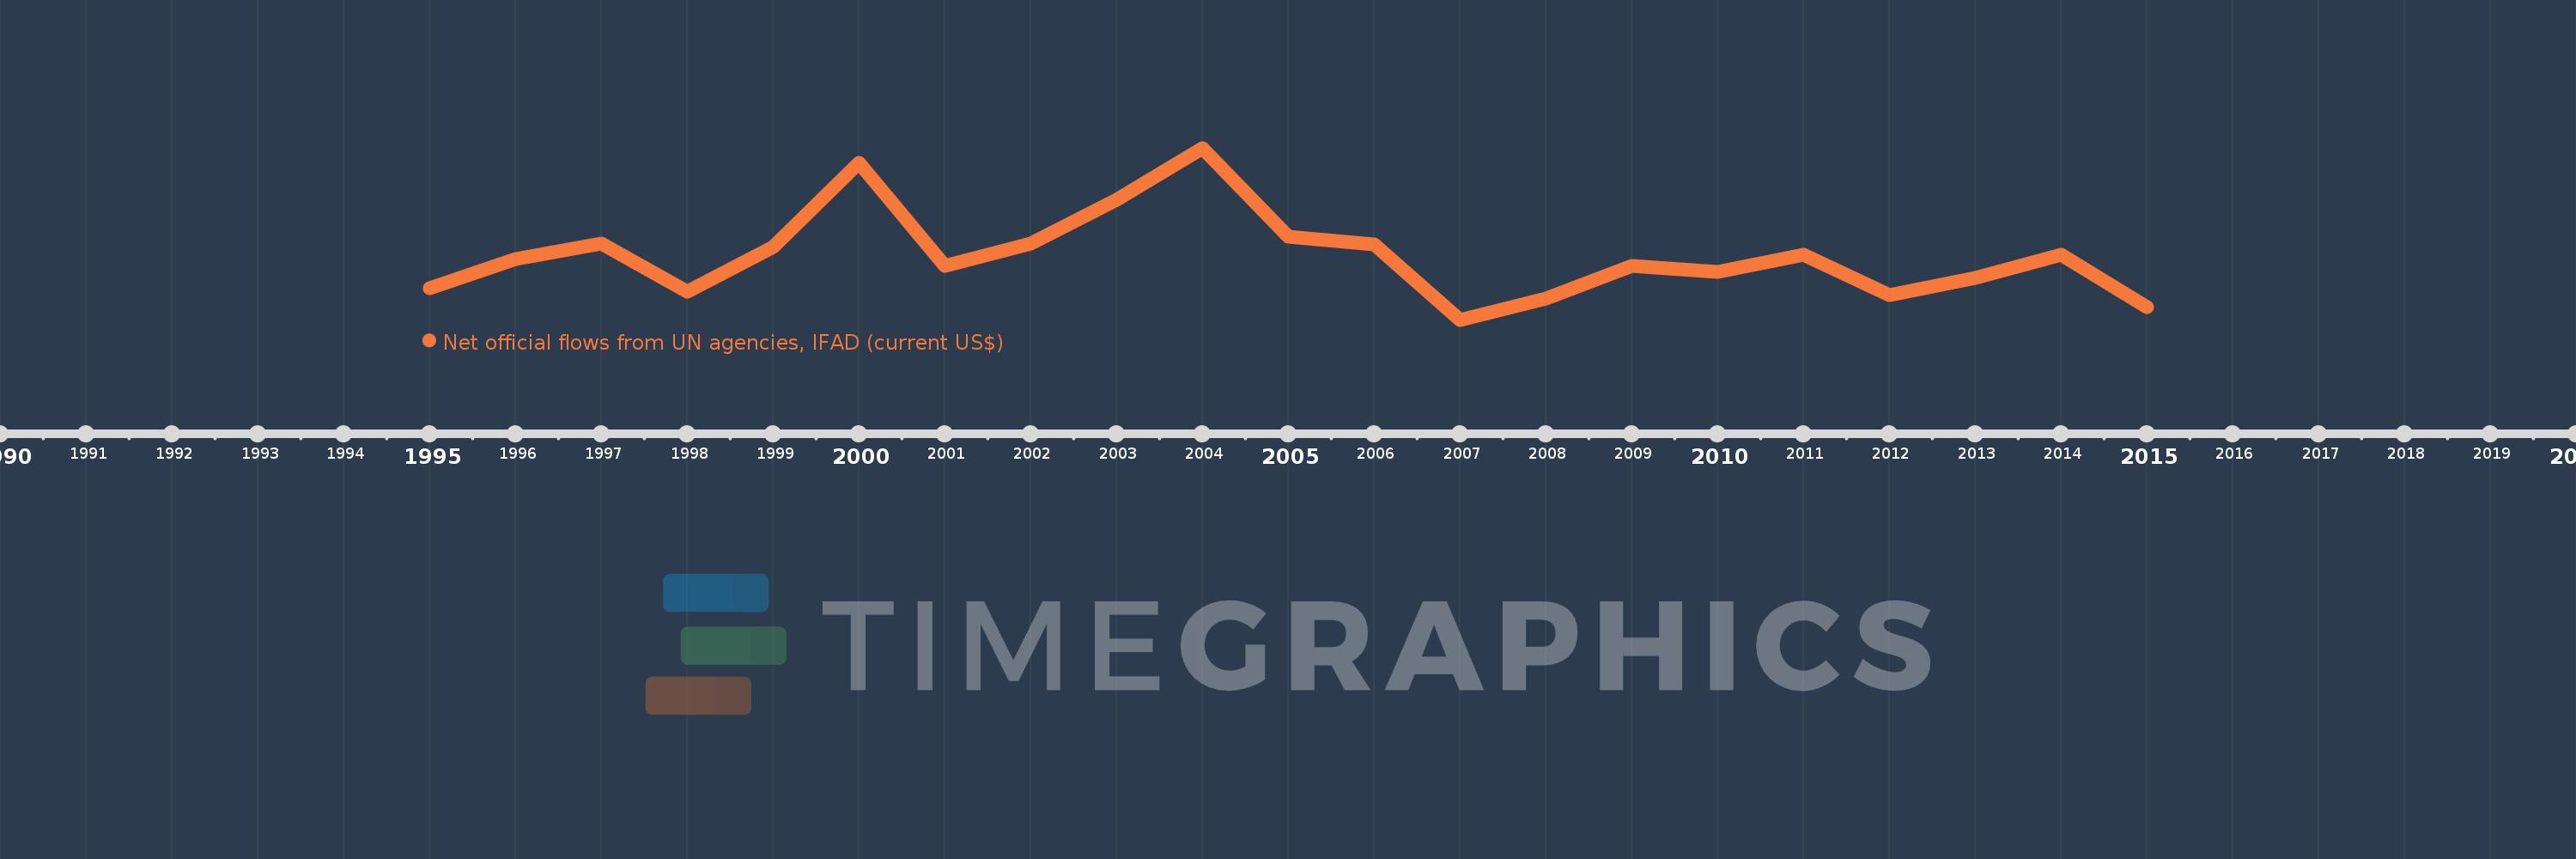
Net official flows from UN agencies, IFAD (current US$)
2015,2014,2013,2012,2011,2010,2009,2008,2007,2006,2005,2004,2003,2002,2001,2000,1999,1998,1997,1996,1995
Diese Statistik in anderen Ländern:
Zeitlinie:
Diese Zeitleiste vorliegt die Graphik ab 1995 J. bis 2015 J. Albania. Die Angaben bis 1994 J. sind nicht vorhanden. Die Zahl aktueller Beobachtungen nach Daten: 21.
Die Quelle (Bezeichnung):
Kennzahlen der Weltentwicklung
Die Quelle (Einrichtung):
Development Assistance Committee of the Organisation for Economic Co-operation and Development, Geographical Distribution of Financial Flows to Developing Countries, Development Co-operation Report, and International Development Statistics database. Data are available online at: www.oecd.org/dac/stats/idsonline.
Kategorien:
Aid Effectiveness
Es wurde aktualisiert:
23 Apr 2017 Jahr
Kennzahlen der Wertänderungen vom Jahr zum Jahr
im Durchschnitt:
1.931 Mln.
Minimum:
-370.0 Tsnd.
1 Jan 2007 Jahr
Maximum:
5.84 Mln.
1 Jan 2004 Jahr
Zum Datum der Beobachtung
Wert
Absolute Veränderung
Die Veränderung bezüglich dem vorherigen Wert
1 Jan 1995 Jahr
780.0 Tsnd.
+780.0 Tsnd.
0.0%
1 Jan 1996 Jahr
1.82 Mln.
+1.04 Mln.
133.33%
1 Jan 1997 Jahr
2.39 Mln.
+570.0 Tsnd.
31.32%
1 Jan 1998 Jahr
630.0 Tsnd.
-1.76 Mln.
-73.64%
1 Jan 1999 Jahr
2.25 Mln.
+1.62 Mln.
257.14%
1 Jan 2000 Jahr
5.31 Mln.
+3.06 Mln.
136.0%
1 Jan 2001 Jahr
1.57 Mln.
-3.74 Mln.
-70.43%
1 Jan 2002 Jahr
2.37 Mln.
+800.0 Tsnd.
50.96%
1 Jan 2003 Jahr
3.96 Mln.
+1.59 Mln.
67.09%
1 Jan 2004 Jahr
5.84 Mln.
+1.88 Mln.
47.47%
1 Jan 2005 Jahr
2.63 Mln.
-3.21 Mln.
-54.97%
1 Jan 2006 Jahr
2.36 Mln.
-270.0 Tsnd.
-10.27%
1 Jan 2007 Jahr
-370.0 Tsnd.
-2.73 Mln.
-115.68%
1 Jan 2008 Jahr
390.0 Tsnd.
+760.0 Tsnd.
-205.41%
1 Jan 2009 Jahr
1.57 Mln.
+1.18 Mln.
302.56%
1 Jan 2010 Jahr
1.36 Mln.
-210.0 Tsnd.
-13.38%
1 Jan 2011 Jahr
1.97 Mln.
+610.0 Tsnd.
44.85%
1 Jan 2012 Jahr
510.0 Tsnd.
-1.46 Mln.
-74.11%
1 Jan 2013 Jahr
1.15 Mln.
+640.0 Tsnd.
125.49%
1 Jan 2014 Jahr
1.98 Mln.
+830.0 Tsnd.
72.17%
1 Jan 2015 Jahr
80.0 Tsnd.
-1.9 Mln.
-95.96%
Bewertung der Länder gemäß mit laufender Statistik nach Jahren


Kommentare: