29
/de/
de
AIzaSyAYiBZKx7MnpbEhh9jyipgxe19OcubqV5w
April 1, 2024
66401
Algeria
DZA
true
2
1
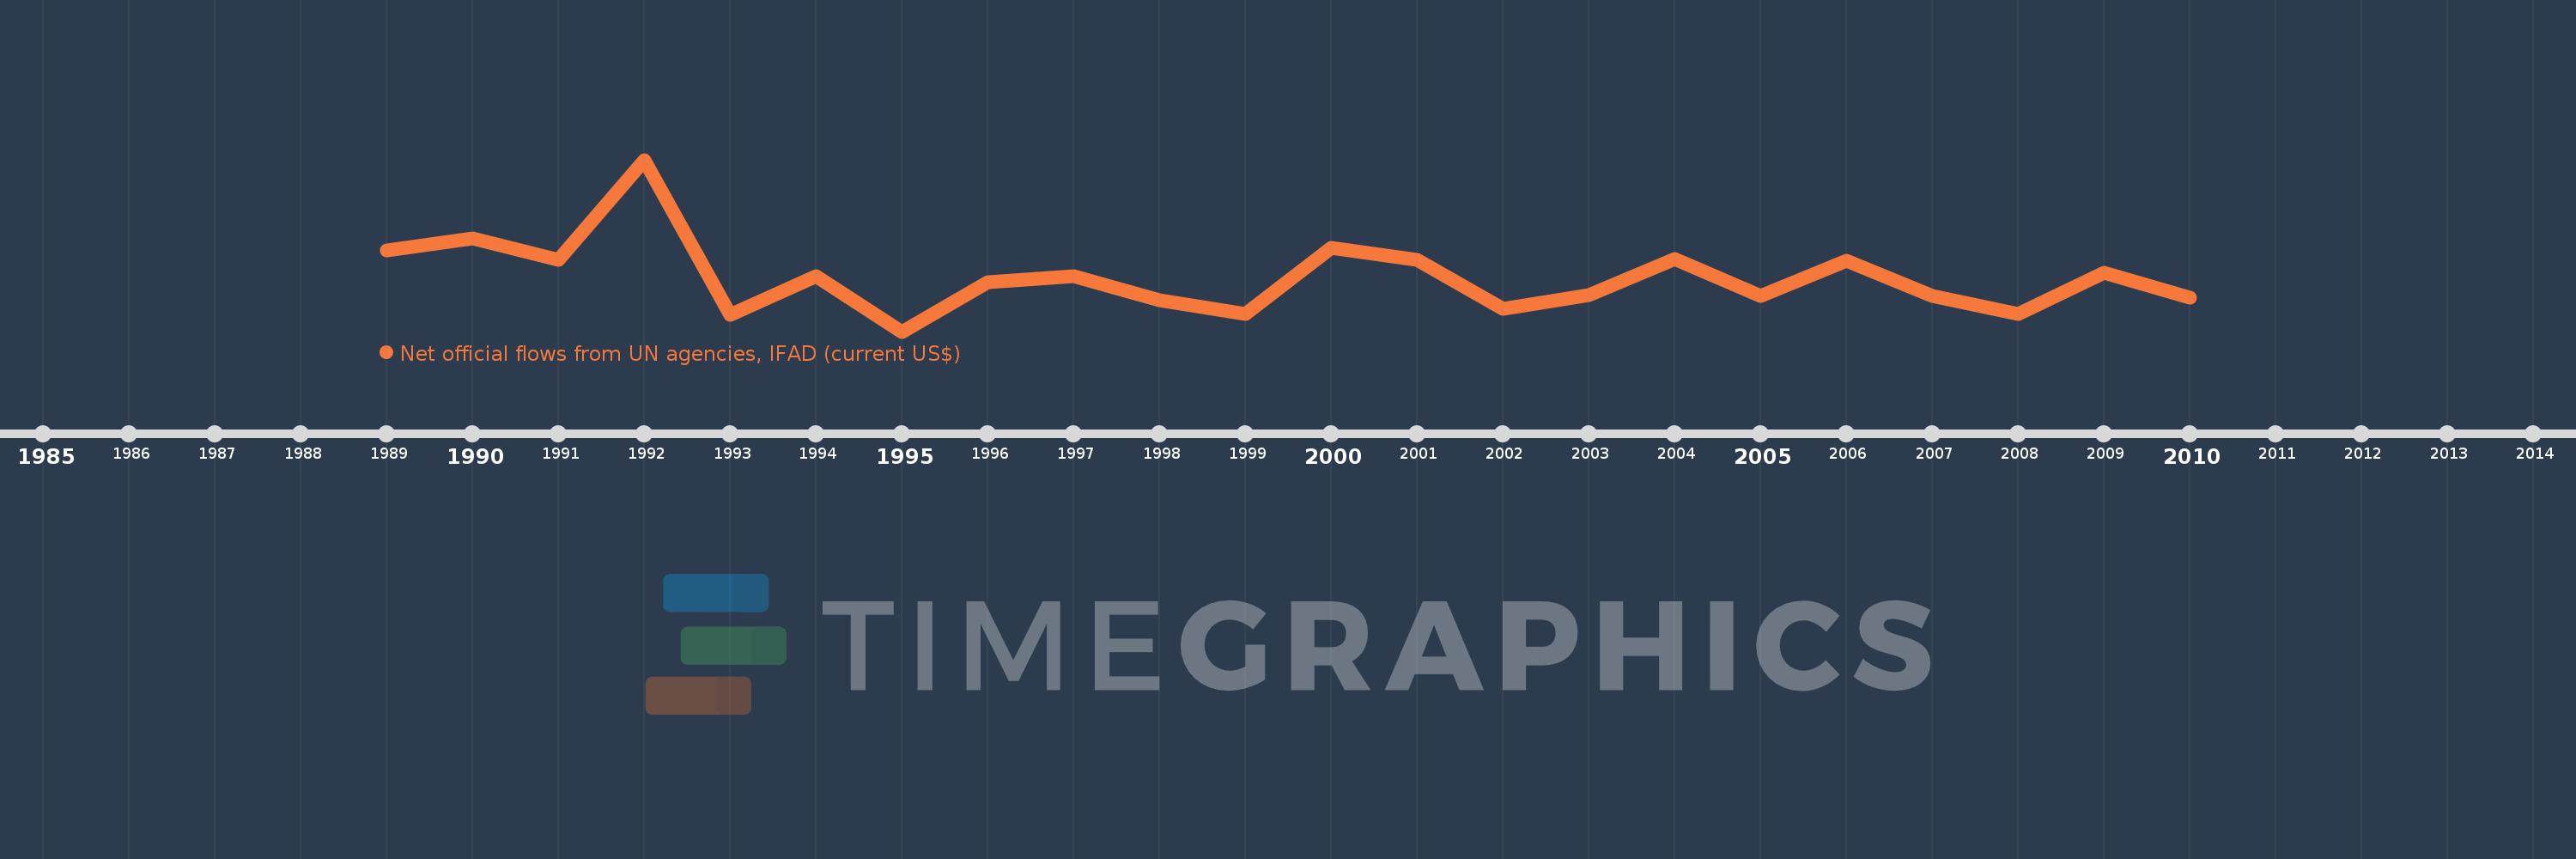
Net official flows from UN agencies, IFAD (current US$)
2010,2009,2008,2007,2006,2005,2004,2003,2002,2001,2000,1999,1998,1997,1996,1995,1994,1993,1992,1991,1990,1989
Diese Statistik in anderen Ländern:
Zeitlinie:
Diese Zeitleiste vorliegt die Graphik ab 1989 J. bis 2010 J. Algeria. Die Angaben bis 1988 J. sind nicht vorhanden. Die Zahl aktueller Beobachtungen nach Daten: 22.
Die Quelle (Bezeichnung):
Kennzahlen der Weltentwicklung
Die Quelle (Einrichtung):
Development Assistance Committee of the Organisation for Economic Co-operation and Development, Geographical Distribution of Financial Flows to Developing Countries, Development Co-operation Report, and International Development Statistics database. Data are available online at: www.oecd.org/dac/stats/idsonline.
Kategorien:
Aid Effectiveness
Es wurde aktualisiert:
23 Apr 2017 Jahr
Kennzahlen der Wertänderungen vom Jahr zum Jahr
im Durchschnitt:
-212.727 Tsnd.
Minimum:
-1.72 Mln.
1 Jan 1995 Jahr
Maximum:
3.1 Mln.
1 Jan 1992 Jahr
Zum Datum der Beobachtung
Wert
Absolute Veränderung
Die Veränderung bezüglich dem vorherigen Wert
1 Jan 1989 Jahr
560.0 Tsnd.
+560.0 Tsnd.
0.0%
1 Jan 1990 Jahr
900.0 Tsnd.
+340.0 Tsnd.
60.71%
1 Jan 1991 Jahr
290.0 Tsnd.
-610.0 Tsnd.
-67.78%
1 Jan 1992 Jahr
3.1 Mln.
+2.81 Mln.
968.97%
1 Jan 1993 Jahr
-1.26 Mln.
-4.36 Mln.
-140.65%
1 Jan 1994 Jahr
-160.0 Tsnd.
+1.1 Mln.
-87.3%
1 Jan 1995 Jahr
-1.72 Mln.
-1.56 Mln.
975.0%
1 Jan 1996 Jahr
-340.0 Tsnd.
+1.38 Mln.
-80.23%
1 Jan 1997 Jahr
-170.0 Tsnd.
+170.0 Tsnd.
-50.0%
1 Jan 1998 Jahr
-850.0 Tsnd.
-680.0 Tsnd.
400.0%
1 Jan 1999 Jahr
-1.22 Mln.
-370.0 Tsnd.
43.53%
1 Jan 2000 Jahr
640.0 Tsnd.
+1.86 Mln.
-152.46%
1 Jan 2001 Jahr
290.0 Tsnd.
-350.0 Tsnd.
-54.69%
1 Jan 2002 Jahr
-1.08 Mln.
-1.37 Mln.
-472.41%
1 Jan 2003 Jahr
-700.0 Tsnd.
+380.0 Tsnd.
-35.19%
1 Jan 2004 Jahr
310.0 Tsnd.
+1.01 Mln.
-144.29%
1 Jan 2005 Jahr
-730.0 Tsnd.
-1.04 Mln.
-335.48%
1 Jan 2006 Jahr
260.0 Tsnd.
+990.0 Tsnd.
-135.62%
1 Jan 2007 Jahr
-720.0 Tsnd.
-980.0 Tsnd.
-376.92%
1 Jan 2008 Jahr
-1.22 Mln.
-500.0 Tsnd.
69.44%
1 Jan 2009 Jahr
-80.0 Tsnd.
+1.14 Mln.
-93.44%
1 Jan 2010 Jahr
-780.0 Tsnd.
-700.0 Tsnd.
875.0%
Bewertung der Länder gemäß mit laufender Statistik nach Jahren


Kommentare: