29
/de/
de
AIzaSyAYiBZKx7MnpbEhh9jyipgxe19OcubqV5w
April 1, 2024
47971
Middle East & North Africa
MEA
false
2
1
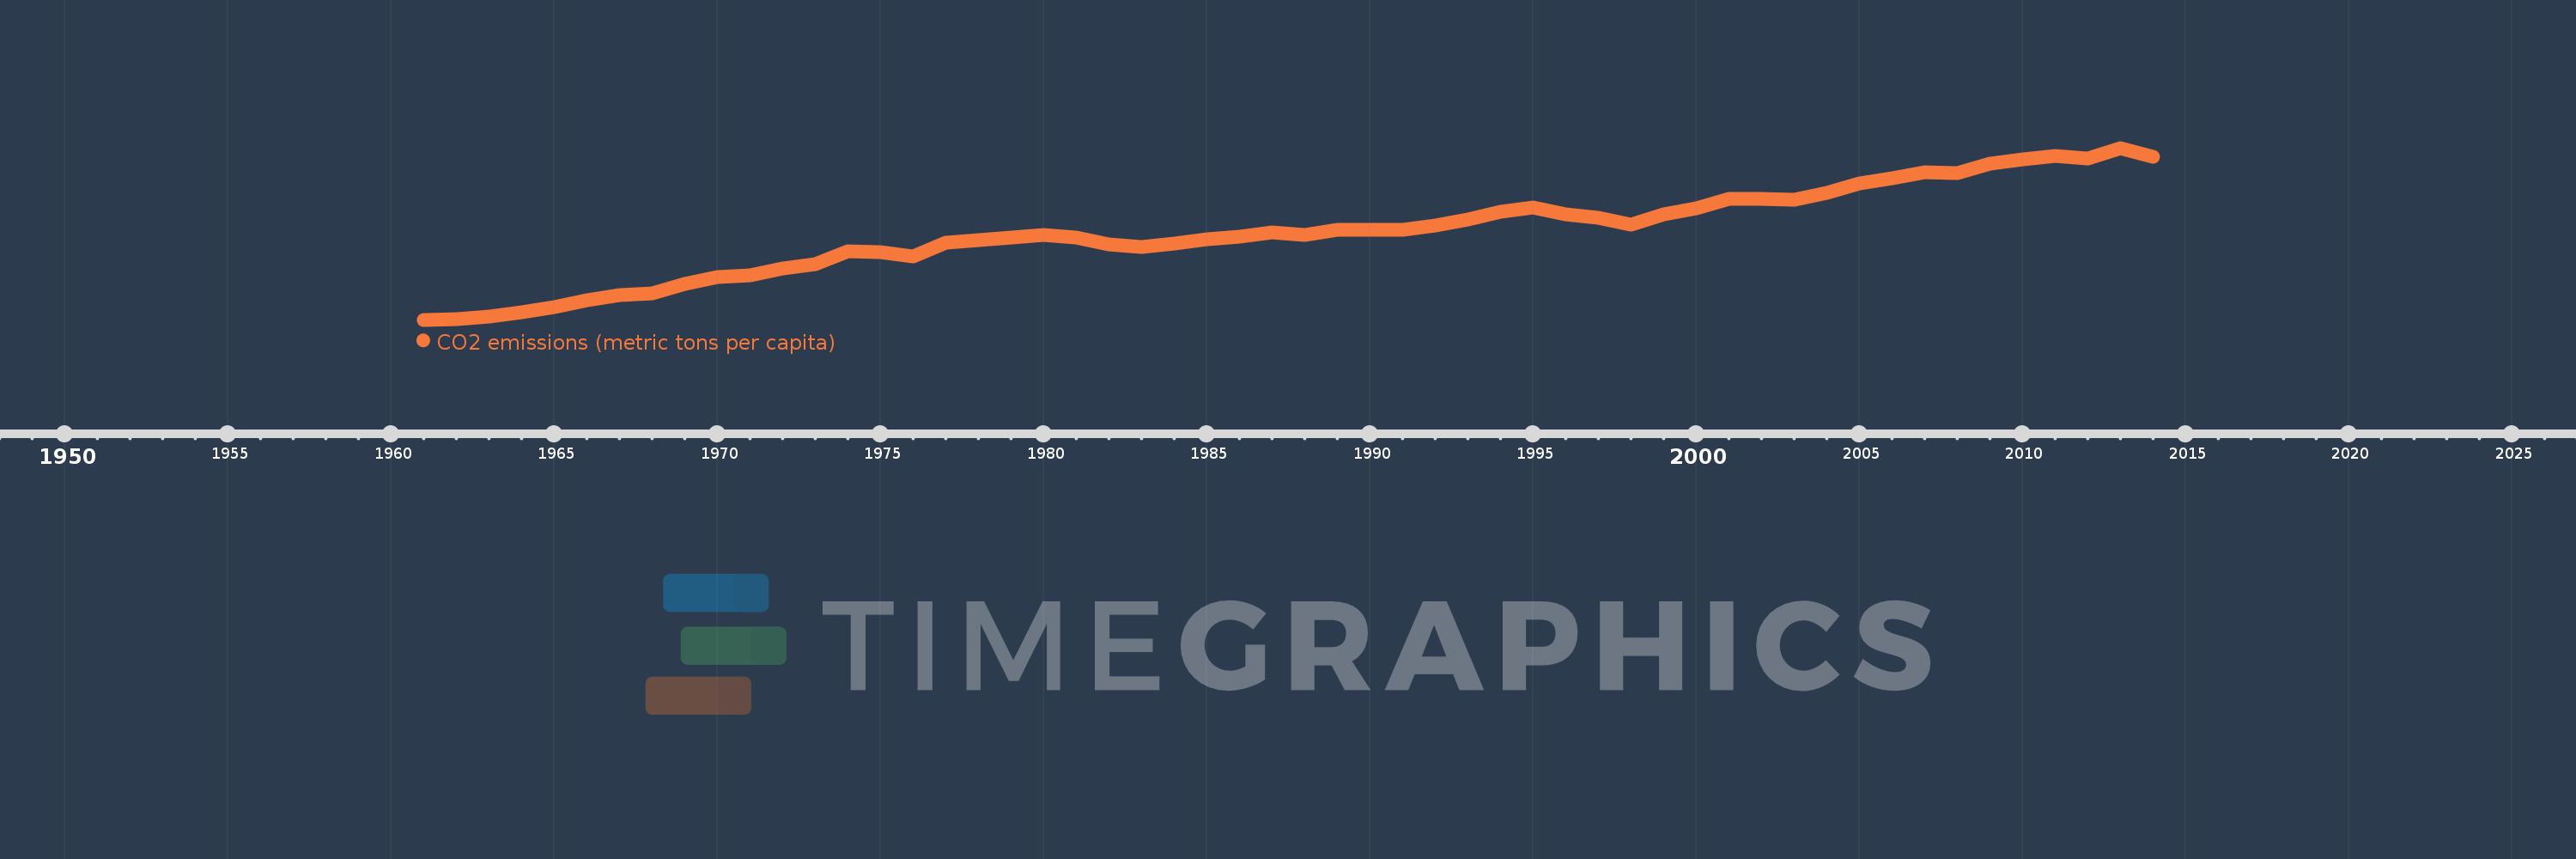
CO2 emissions (metric tons per capita)
2014,2013,2012,2011,2010,2009,2008,2007,2006,2005,2004,2003,2002,2001,2000,1999,1998,1997,1996,1995,1994,1993,1992,1991,1990,1989,1988,1987,1986,1985,1984,1983,1982,1981,1980,1979,1978,1977,1976,1975,1974,1973,1972,1971,1970,1969,1968,1967,1966,1965,1964,1963,1962,1961
Diese Statistik in anderen Ländern:
AfghanistanAlbaniaAlgeriaAndorraAngolaAntigua and BarbudaArab WorldArgentinaArmeniaArubaAustraliaAustriaAzerbaijanBahamas, TheBahrainBangladeshBarbadosBelarusBelgiumBelizeBeninBermudaBhutanBoliviaBosnia and HerzegovinaBotswanaBrazilBritish Virgin IslandsBrunei DarussalamBulgariaBurkina FasoBurundiCabo VerdeCambodiaCameroonCanadaCaribbean small statesCayman IslandsCentral African RepublicCentral Europe and the BalticsChadChileChinaColombiaComorosCongo, Dem. Rep.Congo, Rep.Costa RicaCote d'IvoireCroatiaCubaCuracaoCyprusCzech RepublicDenmarkDjiboutiDominicaDominican RepublicEarly-demographic dividendEast Asia & PacificEast Asia & Pacific (excluding high income)East Asia & Pacific (IDA & IBRD countries)EcuadorEgypt, Arab Rep.El SalvadorEquatorial GuineaEritreaEstoniaEthiopiaEuro areaEurope & Central AsiaEurope & Central Asia (excluding high income)Europe & Central Asia (IDA & IBRD countries)European UnionFaroe IslandsFijiFinlandFragile and conflict affected situationsFranceFrench PolynesiaGabonGambia, TheGeorgiaGermanyGhanaGibraltarGreeceGreenlandGrenadaGuatemalaGuineaGuinea-BissauGuyanaHaitiHeavily indebted poor countries (HIPC)High incomeHondurasHong Kong SAR, ChinaHungaryIBRD onlyIcelandIDA & IBRD totalIDA blendIDA onlyIDA totalIndiaIndonesiaIran, Islamic Rep.IraqIrelandIsraelItalyJamaicaJapanJordanKazakhstanKenyaKiribatiKorea, Dem. People’s Rep.Korea, Rep.KuwaitKyrgyz RepublicLao PDRLate-demographic dividendLatin America & Caribbean Latin America & Caribbean (excluding high income)Latin America & the Caribbean (IDA & IBRD countries)LatviaLeast developed countries: UN classificationLebanonLesothoLiberiaLibyaLiechtensteinLithuaniaLow & middle incomeLow incomeLower middle incomeLuxembourgMacao SAR, ChinaMacedonia, FYRMadagascarMalawiMalaysiaMaldivesMaliMaltaMarshall IslandsMauritaniaMauritiusMexicoMicronesia, Fed. Sts.Middle East & North AfricaMiddle East & North Africa (excluding high income)Middle East & North Africa (IDA & IBRD countries)Middle incomeMoldovaMongoliaMontenegroMoroccoMozambiqueMyanmarNamibiaNauruNepalNetherlandsNew CaledoniaNew ZealandNicaraguaNigerNigeriaNorth AmericaNorwayOECD membersOmanOther small statesPacific island small statesPakistanPalauPanamaPapua New GuineaParaguayPeruPhilippinesPolandPortugalPost-demographic dividendPre-demographic dividendQatarRomaniaRussian FederationRwandaSamoaSao Tome and PrincipeSaudi ArabiaSenegalSerbiaSeychellesSierra LeoneSingaporeSint Maarten (Dutch part)Slovak RepublicSloveniaSmall statesSolomon IslandsSomaliaSouth AfricaSouth AsiaSouth Asia (IDA & IBRD)South SudanSpainSri LankaSt. Kitts and NevisSt. LuciaSt. Vincent and the GrenadinesSub-Saharan Africa Sub-Saharan Africa (excluding high income)Sub-Saharan Africa (IDA & IBRD countries)SudanSurinameSwazilandSwedenSwitzerlandSyrian Arab RepublicTajikistanTanzaniaThailandTimor-LesteTogoTongaTrinidad and TobagoTunisiaTurkeyTurkmenistanTurks and Caicos IslandsUgandaUkraineUnited Arab EmiratesUnited KingdomUnited StatesUpper middle incomeUruguayUzbekistanVanuatuVenezuela, RBVietnamWest Bank and GazaWorldYemen, Rep.ZambiaZimbabwe Zeitlinie:
Diese Zeitleiste vorliegt die Graphik ab 1961 J. bis 2014 J. Middle East & North Africa. Die Angaben bis 1960 J. sind nicht vorhanden. Die Zahl aktueller Beobachtungen nach Daten: 54.
Die Quelle (Bezeichnung):
Kennzahlen der Weltentwicklung
Die Quelle (Einrichtung):
Carbon Dioxide Information Analysis Center, Environmental Sciences Division, Oak Ridge National Laboratory, Tennessee, United States.
Kategorien:
Climate Change, Environment
Es wurde aktualisiert:
23 Apr 2017 Jahr
Kennzahlen der Wertänderungen vom Jahr zum Jahr
Minimum:
0.969
1 Jan 1961 Jahr
Maximum:
6.23
1 Jan 2013 Jahr
Zum Datum der Beobachtung
Wert
Absolute Veränderung
Die Veränderung bezüglich dem vorherigen Wert
1 Jan 1961 Jahr
0.969
+0.969
0.0%
1 Jan 1962 Jahr
0.991
+0.023
2.35%
1 Jan 1963 Jahr
1.062
+0.071
7.16%
1 Jan 1964 Jahr
1.187
+0.125
11.72%
1 Jan 1965 Jahr
1.344
+0.157
13.24%
1 Jan 1966 Jahr
1.555
+0.211
15.71%
1 Jan 1967 Jahr
1.722
+0.167
10.72%
1 Jan 1968 Jahr
1.783
+0.061
3.52%
1 Jan 1969 Jahr
2.069
+0.286
16.07%
1 Jan 1970 Jahr
2.272
+0.203
9.79%
1 Jan 1971 Jahr
2.334
+0.062
2.73%
1 Jan 1972 Jahr
2.551
+0.217
9.31%
1 Jan 1973 Jahr
2.667
+0.116
4.53%
1 Jan 1974 Jahr
3.07
+0.404
15.13%
1 Jan 1975 Jahr
3.028
-0.042
-1.36%
1 Jan 1976 Jahr
2.905
-0.124
-4.08%
1 Jan 1977 Jahr
3.332
+0.427
14.72%
1 Jan 1978 Jahr
3.407
+0.075
2.25%
1 Jan 1979 Jahr
3.484
+0.077
2.27%
1 Jan 1980 Jahr
3.553
+0.069
1.97%
1 Jan 1981 Jahr
3.49
-0.063
-1.76%
1 Jan 1982 Jahr
3.282
-0.209
-5.98%
1 Jan 1983 Jahr
3.209
-0.073
-2.21%
1 Jan 1984 Jahr
3.313
+0.104
3.24%
1 Jan 1985 Jahr
3.434
+0.121
3.65%
1 Jan 1986 Jahr
3.521
+0.087
2.52%
1 Jan 1987 Jahr
3.638
+0.117
3.32%
1 Jan 1988 Jahr
3.577
-0.061
-1.67%
1 Jan 1989 Jahr
3.71
+0.133
3.72%
1 Jan 1990 Jahr
3.728
+0.019
0.5%
1 Jan 1991 Jahr
3.731
+0.002
0.06%
1 Jan 1992 Jahr
3.846
+0.115
3.09%
1 Jan 1993 Jahr
4.036
+0.19
4.94%
1 Jan 1994 Jahr
4.285
+0.249
6.16%
1 Jan 1995 Jahr
4.396
+0.112
2.6%
1 Jan 1996 Jahr
4.185
-0.211
-4.8%
1 Jan 1997 Jahr
4.092
-0.093
-2.23%
1 Jan 1998 Jahr
3.889
-0.203
-4.96%
1 Jan 1999 Jahr
4.186
+0.297
7.64%
1 Jan 2000 Jahr
4.38
+0.194
4.64%
1 Jan 2001 Jahr
4.675
+0.295
6.74%
1 Jan 2002 Jahr
4.662
-0.013
-0.29%
1 Jan 2003 Jahr
4.636
-0.026
-0.55%
1 Jan 2004 Jahr
4.851
+0.214
4.62%
1 Jan 2005 Jahr
5.146
+0.295
6.09%
1 Jan 2006 Jahr
5.289
+0.143
2.79%
1 Jan 2007 Jahr
5.486
+0.197
3.73%
1 Jan 2008 Jahr
5.448
-0.038
-0.7%
1 Jan 2009 Jahr
5.756
+0.308
5.65%
1 Jan 2010 Jahr
5.89
+0.134
2.32%
1 Jan 2011 Jahr
5.987
+0.098
1.66%
1 Jan 2012 Jahr
5.912
-0.076
-1.26%
1 Jan 2013 Jahr
6.23
+0.318
5.38%
1 Jan 2014 Jahr
5.972
-0.258
-4.14%
Bewertung der Länder gemäß mit laufender Statistik nach Jahren


Kommentare: