29
/de/
de
AIzaSyAYiBZKx7MnpbEhh9jyipgxe19OcubqV5w
April 1, 2024
44104
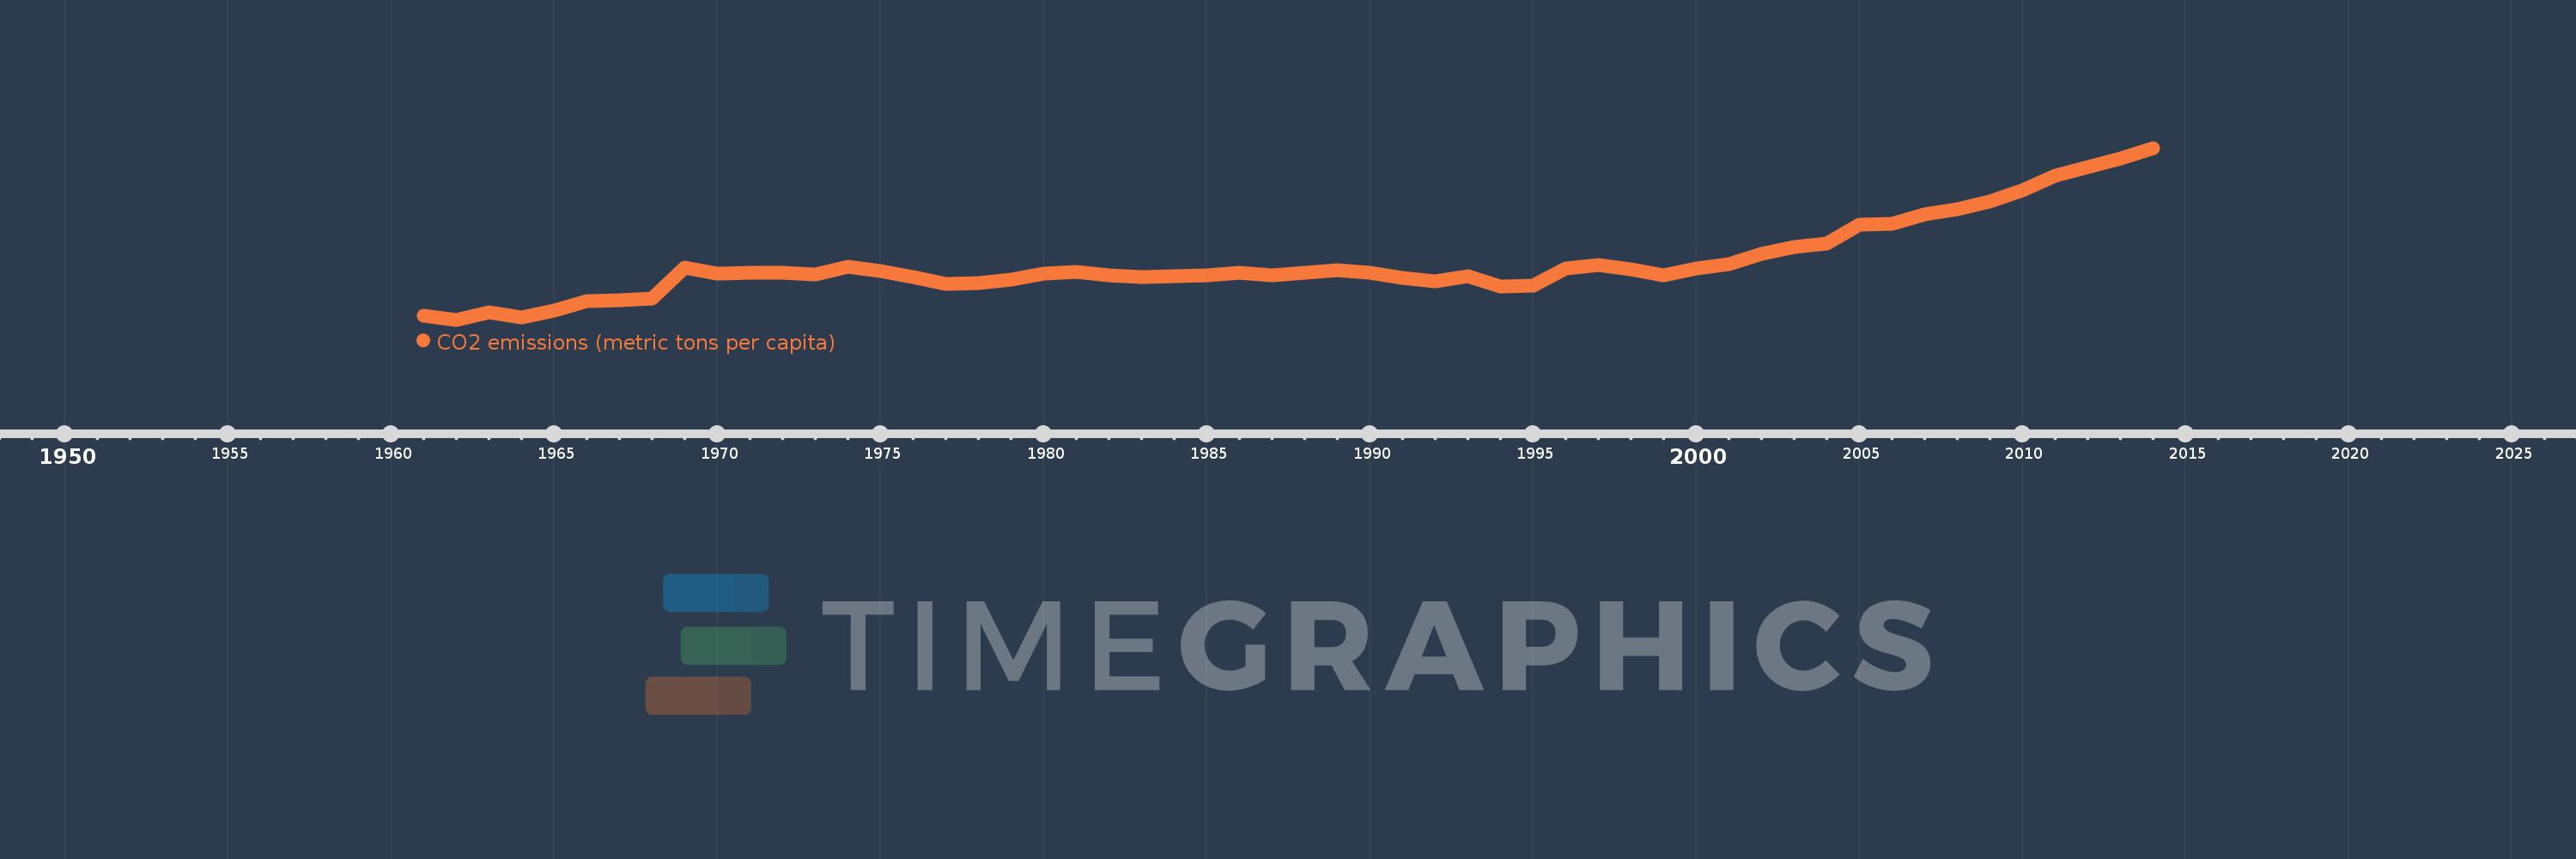
Least developed countries: UN classification
LDC
false
2
1
CO2 emissions (metric tons per capita)
2014,2013,2012,2011,2010,2009,2008,2007,2006,2005,2004,2003,2002,2001,2000,1999,1998,1997,1996,1995,1994,1993,1992,1991,1990,1989,1988,1987,1986,1985,1984,1983,1982,1981,1980,1979,1978,1977,1976,1975,1974,1973,1972,1971,1970,1969,1968,1967,1966,1965,1964,1963,1962,1961
Diese Statistik in anderen Ländern:
AfghanistanAlbaniaAlgeriaAndorraAngolaAntigua and BarbudaArab WorldArgentinaArmeniaArubaAustraliaAustriaAzerbaijanBahamas, TheBahrainBangladeshBarbadosBelarusBelgiumBelizeBeninBermudaBhutanBoliviaBosnia and HerzegovinaBotswanaBrazilBritish Virgin IslandsBrunei DarussalamBulgariaBurkina FasoBurundiCabo VerdeCambodiaCameroonCanadaCaribbean small statesCayman IslandsCentral African RepublicCentral Europe and the BalticsChadChileChinaColombiaComorosCongo, Dem. Rep.Congo, Rep.Costa RicaCote d'IvoireCroatiaCubaCuracaoCyprusCzech RepublicDenmarkDjiboutiDominicaDominican RepublicEarly-demographic dividendEast Asia & PacificEast Asia & Pacific (excluding high income)East Asia & Pacific (IDA & IBRD countries)EcuadorEgypt, Arab Rep.El SalvadorEquatorial GuineaEritreaEstoniaEthiopiaEuro areaEurope & Central AsiaEurope & Central Asia (excluding high income)Europe & Central Asia (IDA & IBRD countries)European UnionFaroe IslandsFijiFinlandFragile and conflict affected situationsFranceFrench PolynesiaGabonGambia, TheGeorgiaGermanyGhanaGibraltarGreeceGreenlandGrenadaGuatemalaGuineaGuinea-BissauGuyanaHaitiHeavily indebted poor countries (HIPC)High incomeHondurasHong Kong SAR, ChinaHungaryIBRD onlyIcelandIDA & IBRD totalIDA blendIDA onlyIDA totalIndiaIndonesiaIran, Islamic Rep.IraqIrelandIsraelItalyJamaicaJapanJordanKazakhstanKenyaKiribatiKorea, Dem. People’s Rep.Korea, Rep.KuwaitKyrgyz RepublicLao PDRLate-demographic dividendLatin America & Caribbean Latin America & Caribbean (excluding high income)Latin America & the Caribbean (IDA & IBRD countries)LatviaLeast developed countries: UN classificationLebanonLesothoLiberiaLibyaLiechtensteinLithuaniaLow & middle incomeLow incomeLower middle incomeLuxembourgMacao SAR, ChinaMacedonia, FYRMadagascarMalawiMalaysiaMaldivesMaliMaltaMarshall IslandsMauritaniaMauritiusMexicoMicronesia, Fed. Sts.Middle East & North AfricaMiddle East & North Africa (excluding high income)Middle East & North Africa (IDA & IBRD countries)Middle incomeMoldovaMongoliaMontenegroMoroccoMozambiqueMyanmarNamibiaNauruNepalNetherlandsNew CaledoniaNew ZealandNicaraguaNigerNigeriaNorth AmericaNorwayOECD membersOmanOther small statesPacific island small statesPakistanPalauPanamaPapua New GuineaParaguayPeruPhilippinesPolandPortugalPost-demographic dividendPre-demographic dividendQatarRomaniaRussian FederationRwandaSamoaSao Tome and PrincipeSaudi ArabiaSenegalSerbiaSeychellesSierra LeoneSingaporeSint Maarten (Dutch part)Slovak RepublicSloveniaSmall statesSolomon IslandsSomaliaSouth AfricaSouth AsiaSouth Asia (IDA & IBRD)South SudanSpainSri LankaSt. Kitts and NevisSt. LuciaSt. Vincent and the GrenadinesSub-Saharan Africa Sub-Saharan Africa (excluding high income)Sub-Saharan Africa (IDA & IBRD countries)SudanSurinameSwazilandSwedenSwitzerlandSyrian Arab RepublicTajikistanTanzaniaThailandTimor-LesteTogoTongaTrinidad and TobagoTunisiaTurkeyTurkmenistanTurks and Caicos IslandsUgandaUkraineUnited Arab EmiratesUnited KingdomUnited StatesUpper middle incomeUruguayUzbekistanVanuatuVenezuela, RBVietnamWest Bank and GazaWorldYemen, Rep.ZambiaZimbabwe Zeitlinie:
Diese Zeitleiste vorliegt die Graphik ab 1961 J. bis 2014 J. Least developed countries: UN classification. Die Angaben bis 1960 J. sind nicht vorhanden. Die Zahl aktueller Beobachtungen nach Daten: 54.
Die Quelle (Bezeichnung):
Kennzahlen der Weltentwicklung
Die Quelle (Einrichtung):
Carbon Dioxide Information Analysis Center, Environmental Sciences Division, Oak Ridge National Laboratory, Tennessee, United States.
Kategorien:
Climate Change, Environment
Es wurde aktualisiert:
23 Apr 2017 Jahr
Kennzahlen der Wertänderungen vom Jahr zum Jahr
Minimum:
0.097
1 Jan 1962 Jahr
Maximum:
0.311
1 Jan 2014 Jahr
Zum Datum der Beobachtung
Wert
Absolute Veränderung
Die Veränderung bezüglich dem vorherigen Wert
1 Jan 1961 Jahr
0.102
+0.102
0.0%
1 Jan 1962 Jahr
0.097
-0.005
-4.97%
1 Jan 1963 Jahr
0.106
+0.009
9.33%
1 Jan 1964 Jahr
0.1
-0.006
-5.68%
1 Jan 1965 Jahr
0.108
+0.008
8.3%
1 Jan 1966 Jahr
0.12
+0.012
10.95%
1 Jan 1967 Jahr
0.121
+0.001
0.44%
1 Jan 1968 Jahr
0.123
+0.003
2.47%
1 Jan 1969 Jahr
0.162
+0.038
30.92%
1 Jan 1970 Jahr
0.154
-0.008
-5.0%
1 Jan 1971 Jahr
0.155
+0.001
0.86%
1 Jan 1972 Jahr
0.155
+0.0
0.28%
1 Jan 1973 Jahr
0.153
-0.003
-1.66%
1 Jan 1974 Jahr
0.163
+0.01
6.5%
1 Jan 1975 Jahr
0.158
-0.005
-2.77%
1 Jan 1976 Jahr
0.15
-0.008
-5.04%
1 Jan 1977 Jahr
0.142
-0.009
-5.8%
1 Jan 1978 Jahr
0.143
+0.002
1.18%
1 Jan 1979 Jahr
0.147
+0.004
2.84%
1 Jan 1980 Jahr
0.154
+0.007
4.42%
1 Jan 1981 Jahr
0.157
+0.003
1.92%
1 Jan 1982 Jahr
0.152
-0.004
-2.82%
1 Jan 1983 Jahr
0.15
-0.003
-1.7%
1 Jan 1984 Jahr
0.151
+0.001
0.55%
1 Jan 1985 Jahr
0.152
+0.001
0.94%
1 Jan 1986 Jahr
0.155
+0.003
1.9%
1 Jan 1987 Jahr
0.152
-0.003
-1.72%
1 Jan 1988 Jahr
0.156
+0.003
2.29%
1 Jan 1989 Jahr
0.159
+0.004
2.34%
1 Jan 1990 Jahr
0.155
-0.005
-3.01%
1 Jan 1991 Jahr
0.149
-0.006
-3.79%
1 Jan 1992 Jahr
0.145
-0.004
-2.6%
1 Jan 1993 Jahr
0.151
+0.007
4.6%
1 Jan 1994 Jahr
0.138
-0.014
-8.97%
1 Jan 1995 Jahr
0.139
+0.001
0.55%
1 Jan 1996 Jahr
0.161
+0.022
15.9%
1 Jan 1997 Jahr
0.165
+0.004
2.77%
1 Jan 1998 Jahr
0.16
-0.005
-2.89%
1 Jan 1999 Jahr
0.152
-0.008
-5.16%
1 Jan 2000 Jahr
0.161
+0.009
6.11%
1 Jan 2001 Jahr
0.166
+0.005
2.86%
1 Jan 2002 Jahr
0.179
+0.013
7.63%
1 Jan 2003 Jahr
0.188
+0.009
5.04%
1 Jan 2004 Jahr
0.192
+0.004
2.28%
1 Jan 2005 Jahr
0.215
+0.023
12.07%
1 Jan 2006 Jahr
0.216
+0.001
0.55%
1 Jan 2007 Jahr
0.228
+0.011
5.21%
1 Jan 2008 Jahr
0.235
+0.007
3.26%
1 Jan 2009 Jahr
0.244
+0.009
3.93%
1 Jan 2010 Jahr
0.258
+0.013
5.52%
1 Jan 2011 Jahr
0.276
+0.018
6.92%
1 Jan 2012 Jahr
0.287
+0.011
4.16%
1 Jan 2013 Jahr
0.298
+0.011
3.97%
1 Jan 2014 Jahr
0.311
+0.012
4.09%
Bewertung der Länder gemäß mit laufender Statistik nach Jahren


Kommentare: