29
/de/
de
AIzaSyAYiBZKx7MnpbEhh9jyipgxe19OcubqV5w
April 1, 2024
235484
Senegal
SEN
true
2
1
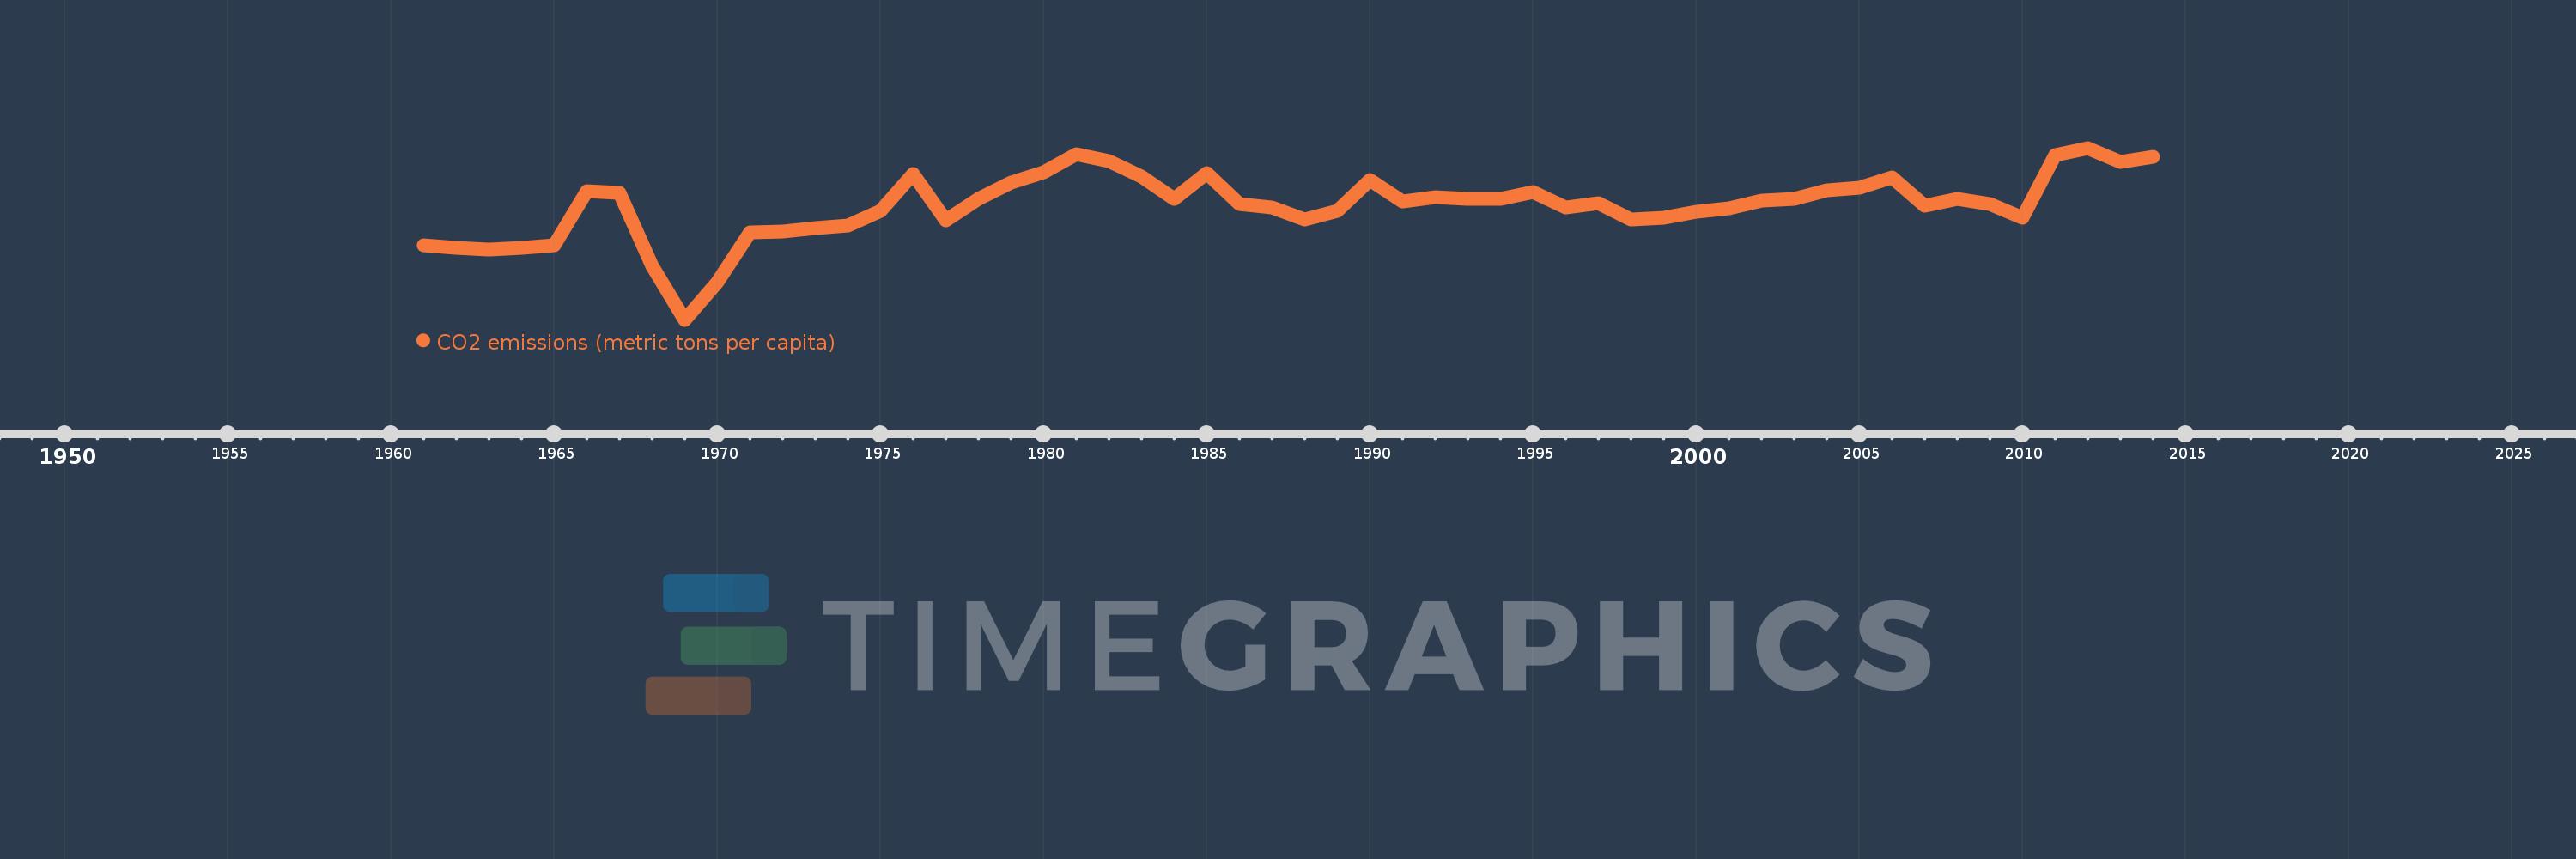
CO2 emissions (metric tons per capita)
2014,2013,2012,2011,2010,2009,2008,2007,2006,2005,2004,2003,2002,2001,2000,1999,1998,1997,1996,1995,1994,1993,1992,1991,1990,1989,1988,1987,1986,1985,1984,1983,1982,1981,1980,1979,1978,1977,1976,1975,1974,1973,1972,1971,1970,1969,1968,1967,1966,1965,1964,1963,1962,1961
Diese Statistik in anderen Ländern:
AfghanistanAlbaniaAlgeriaAndorraAngolaAntigua and BarbudaArab WorldArgentinaArmeniaArubaAustraliaAustriaAzerbaijanBahamas, TheBahrainBangladeshBarbadosBelarusBelgiumBelizeBeninBermudaBhutanBoliviaBosnia and HerzegovinaBotswanaBrazilBritish Virgin IslandsBrunei DarussalamBulgariaBurkina FasoBurundiCabo VerdeCambodiaCameroonCanadaCaribbean small statesCayman IslandsCentral African RepublicCentral Europe and the BalticsChadChileChinaColombiaComorosCongo, Dem. Rep.Congo, Rep.Costa RicaCote d'IvoireCroatiaCubaCuracaoCyprusCzech RepublicDenmarkDjiboutiDominicaDominican RepublicEarly-demographic dividendEast Asia & PacificEast Asia & Pacific (excluding high income)East Asia & Pacific (IDA & IBRD countries)EcuadorEgypt, Arab Rep.El SalvadorEquatorial GuineaEritreaEstoniaEthiopiaEuro areaEurope & Central AsiaEurope & Central Asia (excluding high income)Europe & Central Asia (IDA & IBRD countries)European UnionFaroe IslandsFijiFinlandFragile and conflict affected situationsFranceFrench PolynesiaGabonGambia, TheGeorgiaGermanyGhanaGibraltarGreeceGreenlandGrenadaGuatemalaGuineaGuinea-BissauGuyanaHaitiHeavily indebted poor countries (HIPC)High incomeHondurasHong Kong SAR, ChinaHungaryIBRD onlyIcelandIDA & IBRD totalIDA blendIDA onlyIDA totalIndiaIndonesiaIran, Islamic Rep.IraqIrelandIsraelItalyJamaicaJapanJordanKazakhstanKenyaKiribatiKorea, Dem. People’s Rep.Korea, Rep.KuwaitKyrgyz RepublicLao PDRLate-demographic dividendLatin America & Caribbean Latin America & Caribbean (excluding high income)Latin America & the Caribbean (IDA & IBRD countries)LatviaLeast developed countries: UN classificationLebanonLesothoLiberiaLibyaLiechtensteinLithuaniaLow & middle incomeLow incomeLower middle incomeLuxembourgMacao SAR, ChinaMacedonia, FYRMadagascarMalawiMalaysiaMaldivesMaliMaltaMarshall IslandsMauritaniaMauritiusMexicoMicronesia, Fed. Sts.Middle East & North AfricaMiddle East & North Africa (excluding high income)Middle East & North Africa (IDA & IBRD countries)Middle incomeMoldovaMongoliaMontenegroMoroccoMozambiqueMyanmarNamibiaNauruNepalNetherlandsNew CaledoniaNew ZealandNicaraguaNigerNigeriaNorth AmericaNorwayOECD membersOmanOther small statesPacific island small statesPakistanPalauPanamaPapua New GuineaParaguayPeruPhilippinesPolandPortugalPost-demographic dividendPre-demographic dividendQatarRomaniaRussian FederationRwandaSamoaSao Tome and PrincipeSaudi ArabiaSenegalSerbiaSeychellesSierra LeoneSingaporeSint Maarten (Dutch part)Slovak RepublicSloveniaSmall statesSolomon IslandsSomaliaSouth AfricaSouth AsiaSouth Asia (IDA & IBRD)South SudanSpainSri LankaSt. Kitts and NevisSt. LuciaSt. Vincent and the GrenadinesSub-Saharan Africa Sub-Saharan Africa (excluding high income)Sub-Saharan Africa (IDA & IBRD countries)SudanSurinameSwazilandSwedenSwitzerlandSyrian Arab RepublicTajikistanTanzaniaThailandTimor-LesteTogoTongaTrinidad and TobagoTunisiaTurkeyTurkmenistanTurks and Caicos IslandsUgandaUkraineUnited Arab EmiratesUnited KingdomUnited StatesUpper middle incomeUruguayUzbekistanVanuatuVenezuela, RBVietnamWest Bank and GazaWorldYemen, Rep.ZambiaZimbabwe Zeitlinie:
Diese Zeitleiste vorliegt die Graphik ab 1961 J. bis 2014 J. Senegal. Die Angaben bis 1960 J. sind nicht vorhanden. Die Zahl aktueller Beobachtungen nach Daten: 54.
Die Quelle (Bezeichnung):
Kennzahlen der Weltentwicklung
Die Quelle (Einrichtung):
Carbon Dioxide Information Analysis Center, Environmental Sciences Division, Oak Ridge National Laboratory, Tennessee, United States.
Kategorien:
Climate Change, Environment
Es wurde aktualisiert:
23 Apr 2017 Jahr
Kennzahlen der Wertänderungen vom Jahr zum Jahr
Minimum:
-0.02
1 Jan 1969 Jahr
Maximum:
0.626
1 Jan 2012 Jahr
Zum Datum der Beobachtung
Wert
Absolute Veränderung
Die Veränderung bezüglich dem vorherigen Wert
1 Jan 1961 Jahr
0.261
+0.261
0.0%
1 Jan 1962 Jahr
0.249
-0.012
-4.42%
1 Jan 1963 Jahr
0.243
-0.007
-2.71%
1 Jan 1964 Jahr
0.25
+0.007
2.97%
1 Jan 1965 Jahr
0.26
+0.011
4.29%
1 Jan 1966 Jahr
0.464
+0.204
78.24%
1 Jan 1967 Jahr
0.458
-0.006
-1.32%
1 Jan 1968 Jahr
0.181
-0.277
-60.42%
1 Jan 1969 Jahr
-0.02
-0.202
-111.19%
1 Jan 1970 Jahr
0.12
+0.14
-691.51%
1 Jan 1971 Jahr
0.31
+0.19
158.59%
1 Jan 1972 Jahr
0.311
+0.001
0.25%
1 Jan 1973 Jahr
0.325
+0.013
4.31%
1 Jan 1974 Jahr
0.335
+0.011
3.32%
1 Jan 1975 Jahr
0.389
+0.053
15.9%
1 Jan 1976 Jahr
0.527
+0.138
35.54%
1 Jan 1977 Jahr
0.353
-0.174
-33.04%
1 Jan 1978 Jahr
0.435
+0.082
23.3%
1 Jan 1979 Jahr
0.497
+0.062
14.3%
1 Jan 1980 Jahr
0.535
+0.038
7.58%
1 Jan 1981 Jahr
0.602
+0.067
12.55%
1 Jan 1982 Jahr
0.576
-0.026
-4.3%
1 Jan 1983 Jahr
0.519
-0.057
-9.93%
1 Jan 1984 Jahr
0.434
-0.084
-16.29%
1 Jan 1985 Jahr
0.53
+0.095
21.94%
1 Jan 1986 Jahr
0.416
-0.114
-21.48%
1 Jan 1987 Jahr
0.401
-0.015
-3.55%
1 Jan 1988 Jahr
0.358
-0.043
-10.66%
1 Jan 1989 Jahr
0.388
+0.03
8.39%
1 Jan 1990 Jahr
0.507
+0.119
30.64%
1 Jan 1991 Jahr
0.424
-0.084
-16.51%
1 Jan 1992 Jahr
0.442
+0.018
4.34%
1 Jan 1993 Jahr
0.436
-0.006
-1.46%
1 Jan 1994 Jahr
0.436
+0.001
0.21%
1 Jan 1995 Jahr
0.46
+0.024
5.48%
1 Jan 1996 Jahr
0.401
-0.059
-12.85%
1 Jan 1997 Jahr
0.418
+0.017
4.29%
1 Jan 1998 Jahr
0.356
-0.062
-14.88%
1 Jan 1999 Jahr
0.365
+0.009
2.55%
1 Jan 2000 Jahr
0.385
+0.019
5.33%
1 Jan 2001 Jahr
0.399
+0.015
3.82%
1 Jan 2002 Jahr
0.428
+0.029
7.16%
1 Jan 2003 Jahr
0.434
+0.006
1.43%
1 Jan 2004 Jahr
0.466
+0.032
7.39%
1 Jan 2005 Jahr
0.477
+0.011
2.34%
1 Jan 2006 Jahr
0.516
+0.039
8.1%
1 Jan 2007 Jahr
0.409
-0.107
-20.79%
1 Jan 2008 Jahr
0.436
+0.027
6.6%
1 Jan 2009 Jahr
0.416
-0.019
-4.37%
1 Jan 2010 Jahr
0.364
-0.052
-12.52%
1 Jan 2011 Jahr
0.598
+0.233
64.07%
1 Jan 2012 Jahr
0.626
+0.029
4.81%
1 Jan 2013 Jahr
0.574
-0.052
-8.34%
1 Jan 2014 Jahr
0.592
+0.018
3.14%
Bewertung der Länder gemäß mit laufender Statistik nach Jahren


Kommentare: