29
/de/
de
AIzaSyAYiBZKx7MnpbEhh9jyipgxe19OcubqV5w
April 1, 2024
284404
Yemen, Rep.
YEM
true
2
1
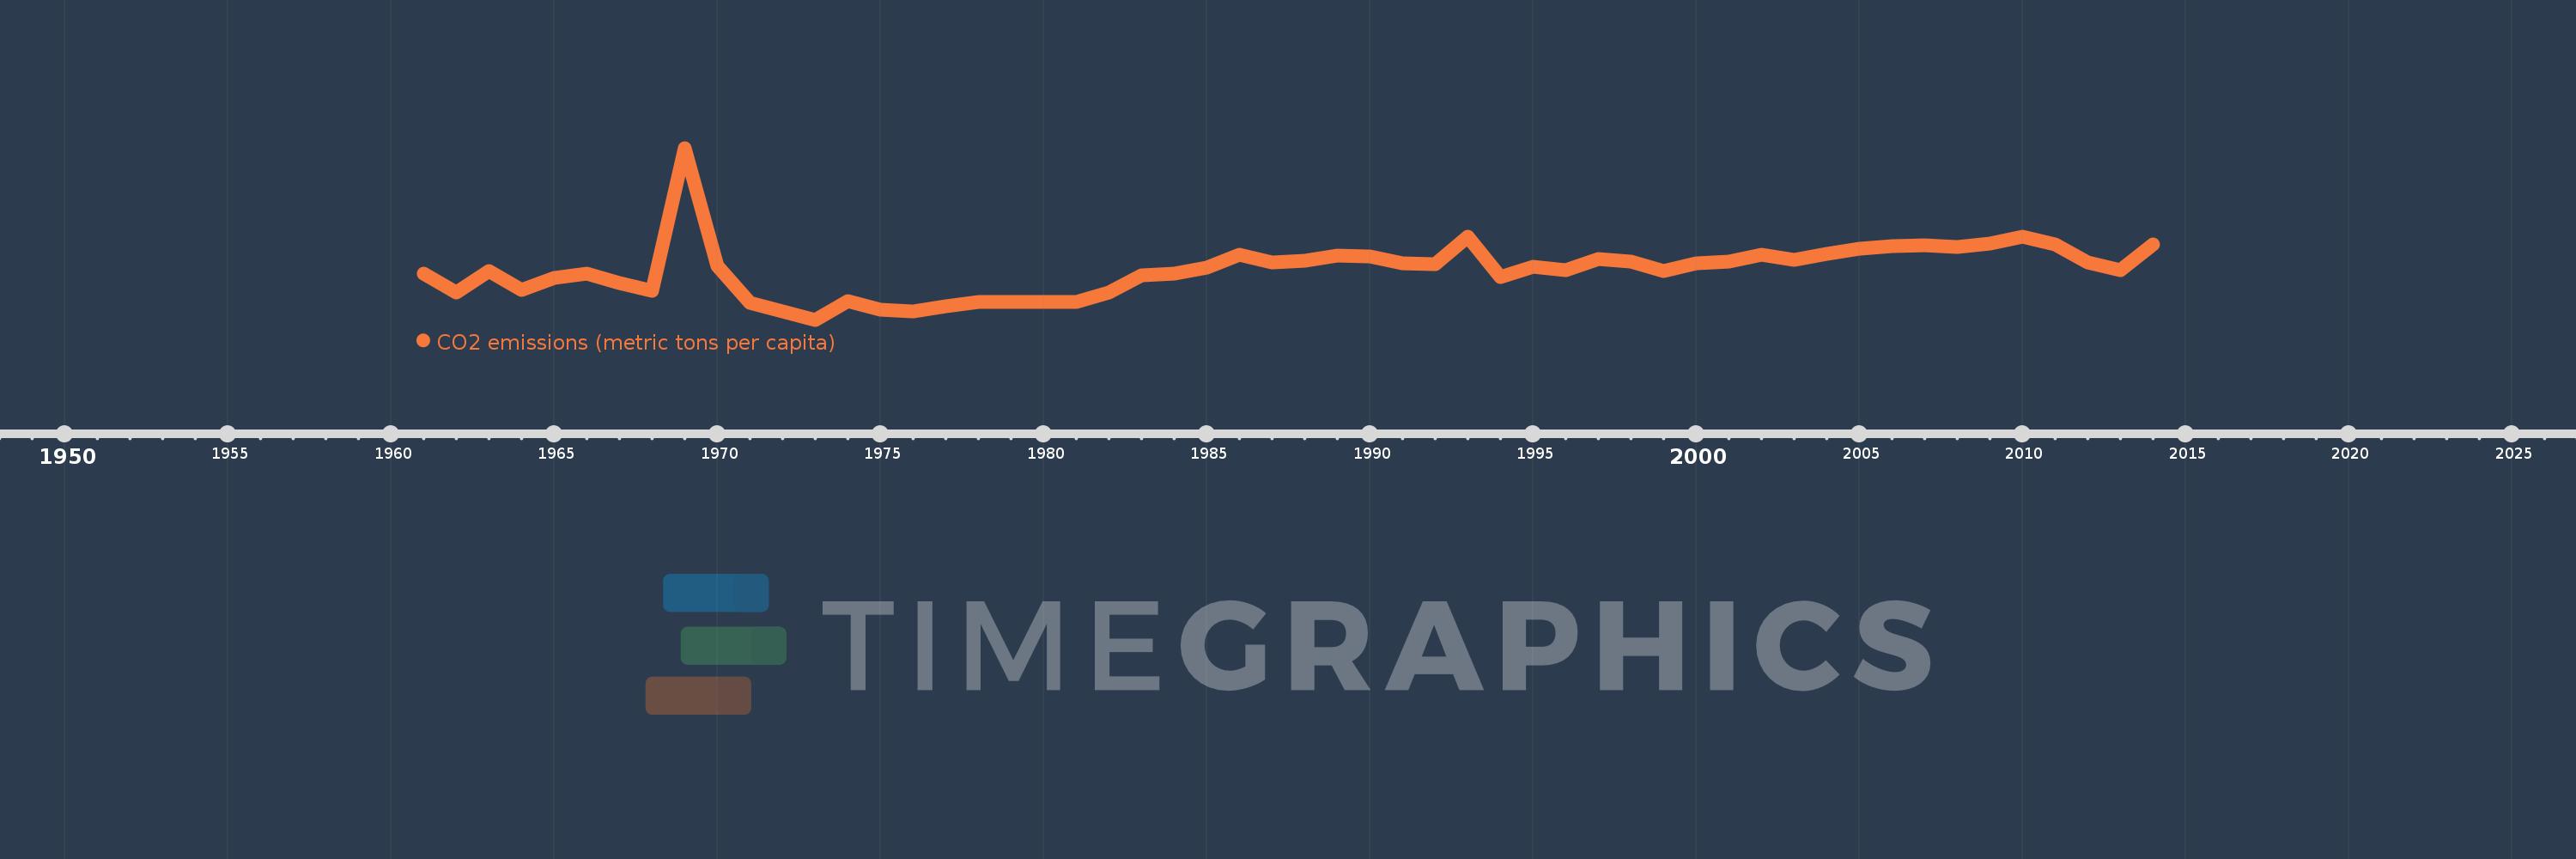
CO2 emissions (metric tons per capita)
2014,2013,2012,2011,2010,2009,2008,2007,2006,2005,2004,2003,2002,2001,2000,1999,1998,1997,1996,1995,1994,1993,1992,1991,1990,1989,1988,1987,1986,1985,1984,1983,1982,1981,1980,1979,1978,1977,1976,1975,1974,1973,1972,1971,1970,1969,1968,1967,1966,1965,1964,1963,1962,1961
Diese Statistik in anderen Ländern:
AfghanistanAlbaniaAlgeriaAndorraAngolaAntigua and BarbudaArab WorldArgentinaArmeniaArubaAustraliaAustriaAzerbaijanBahamas, TheBahrainBangladeshBarbadosBelarusBelgiumBelizeBeninBermudaBhutanBoliviaBosnia and HerzegovinaBotswanaBrazilBritish Virgin IslandsBrunei DarussalamBulgariaBurkina FasoBurundiCabo VerdeCambodiaCameroonCanadaCaribbean small statesCayman IslandsCentral African RepublicCentral Europe and the BalticsChadChileChinaColombiaComorosCongo, Dem. Rep.Congo, Rep.Costa RicaCote d'IvoireCroatiaCubaCuracaoCyprusCzech RepublicDenmarkDjiboutiDominicaDominican RepublicEarly-demographic dividendEast Asia & PacificEast Asia & Pacific (excluding high income)East Asia & Pacific (IDA & IBRD countries)EcuadorEgypt, Arab Rep.El SalvadorEquatorial GuineaEritreaEstoniaEthiopiaEuro areaEurope & Central AsiaEurope & Central Asia (excluding high income)Europe & Central Asia (IDA & IBRD countries)European UnionFaroe IslandsFijiFinlandFragile and conflict affected situationsFranceFrench PolynesiaGabonGambia, TheGeorgiaGermanyGhanaGibraltarGreeceGreenlandGrenadaGuatemalaGuineaGuinea-BissauGuyanaHaitiHeavily indebted poor countries (HIPC)High incomeHondurasHong Kong SAR, ChinaHungaryIBRD onlyIcelandIDA & IBRD totalIDA blendIDA onlyIDA totalIndiaIndonesiaIran, Islamic Rep.IraqIrelandIsraelItalyJamaicaJapanJordanKazakhstanKenyaKiribatiKorea, Dem. People’s Rep.Korea, Rep.KuwaitKyrgyz RepublicLao PDRLate-demographic dividendLatin America & Caribbean Latin America & Caribbean (excluding high income)Latin America & the Caribbean (IDA & IBRD countries)LatviaLeast developed countries: UN classificationLebanonLesothoLiberiaLibyaLiechtensteinLithuaniaLow & middle incomeLow incomeLower middle incomeLuxembourgMacao SAR, ChinaMacedonia, FYRMadagascarMalawiMalaysiaMaldivesMaliMaltaMarshall IslandsMauritaniaMauritiusMexicoMicronesia, Fed. Sts.Middle East & North AfricaMiddle East & North Africa (excluding high income)Middle East & North Africa (IDA & IBRD countries)Middle incomeMoldovaMongoliaMontenegroMoroccoMozambiqueMyanmarNamibiaNauruNepalNetherlandsNew CaledoniaNew ZealandNicaraguaNigerNigeriaNorth AmericaNorwayOECD membersOmanOther small statesPacific island small statesPakistanPalauPanamaPapua New GuineaParaguayPeruPhilippinesPolandPortugalPost-demographic dividendPre-demographic dividendQatarRomaniaRussian FederationRwandaSamoaSao Tome and PrincipeSaudi ArabiaSenegalSerbiaSeychellesSierra LeoneSingaporeSint Maarten (Dutch part)Slovak RepublicSloveniaSmall statesSolomon IslandsSomaliaSouth AfricaSouth AsiaSouth Asia (IDA & IBRD)South SudanSpainSri LankaSt. Kitts and NevisSt. LuciaSt. Vincent and the GrenadinesSub-Saharan Africa Sub-Saharan Africa (excluding high income)Sub-Saharan Africa (IDA & IBRD countries)SudanSurinameSwazilandSwedenSwitzerlandSyrian Arab RepublicTajikistanTanzaniaThailandTimor-LesteTogoTongaTrinidad and TobagoTunisiaTurkeyTurkmenistanTurks and Caicos IslandsUgandaUkraineUnited Arab EmiratesUnited KingdomUnited StatesUpper middle incomeUruguayUzbekistanVanuatuVenezuela, RBVietnamWest Bank and GazaWorldYemen, Rep.ZambiaZimbabwe Zeitlinie:
Diese Zeitleiste vorliegt die Graphik ab 1961 J. bis 2014 J. Yemen, Rep.. Die Angaben bis 1960 J. sind nicht vorhanden. Die Zahl aktueller Beobachtungen nach Daten: 54.
Die Quelle (Bezeichnung):
Kennzahlen der Weltentwicklung
Die Quelle (Einrichtung):
Carbon Dioxide Information Analysis Center, Environmental Sciences Division, Oak Ridge National Laboratory, Tennessee, United States.
Kategorien:
Climate Change, Environment
Es wurde aktualisiert:
23 Apr 2017 Jahr
Kennzahlen der Wertänderungen vom Jahr zum Jahr
Minimum:
0.235
1 Jan 1973 Jahr
Maximum:
1.962
1 Jan 1969 Jahr
Zum Datum der Beobachtung
Wert
Absolute Veränderung
Die Veränderung bezüglich dem vorherigen Wert
1 Jan 1961 Jahr
0.703
+0.703
0.0%
1 Jan 1962 Jahr
0.508
-0.196
-27.83%
1 Jan 1963 Jahr
0.728
+0.22
43.41%
1 Jan 1964 Jahr
0.538
-0.19
-26.15%
1 Jan 1965 Jahr
0.658
+0.12
22.4%
1 Jan 1966 Jahr
0.7
+0.042
6.32%
1 Jan 1967 Jahr
0.606
-0.094
-13.41%
1 Jan 1968 Jahr
0.524
-0.082
-13.47%
1 Jan 1969 Jahr
1.962
+1.437
274.21%
1 Jan 1970 Jahr
0.774
-1.188
-60.56%
1 Jan 1971 Jahr
0.408
-0.366
-47.27%
1 Jan 1972 Jahr
0.315
-0.093
-22.8%
1 Jan 1973 Jahr
0.235
-0.08
-25.45%
1 Jan 1974 Jahr
0.421
+0.186
79.3%
1 Jan 1975 Jahr
0.339
-0.082
-19.44%
1 Jan 1976 Jahr
0.32
-0.02
-5.81%
1 Jan 1977 Jahr
0.367
+0.047
14.85%
1 Jan 1978 Jahr
0.413
+0.046
12.41%
1 Jan 1979 Jahr
0.415
+0.002
0.58%
1 Jan 1980 Jahr
0.415
+0.0
0.05%
1 Jan 1981 Jahr
0.412
-0.003
-0.8%
1 Jan 1982 Jahr
0.506
+0.094
22.79%
1 Jan 1983 Jahr
0.684
+0.178
35.24%
1 Jan 1984 Jahr
0.7
+0.016
2.35%
1 Jan 1985 Jahr
0.763
+0.063
9.0%
1 Jan 1986 Jahr
0.886
+0.123
16.11%
1 Jan 1987 Jahr
0.814
-0.071
-8.06%
1 Jan 1988 Jahr
0.824
+0.009
1.14%
1 Jan 1989 Jahr
0.876
+0.053
6.4%
1 Jan 1990 Jahr
0.875
-0.002
-0.18%
1 Jan 1991 Jahr
0.802
-0.072
-8.29%
1 Jan 1992 Jahr
0.794
-0.009
-1.07%
1 Jan 1993 Jahr
1.073
+0.279
35.17%
1 Jan 1994 Jahr
0.664
-0.409
-38.15%
1 Jan 1995 Jahr
0.765
+0.101
15.26%
1 Jan 1996 Jahr
0.737
-0.028
-3.64%
1 Jan 1997 Jahr
0.846
+0.109
14.82%
1 Jan 1998 Jahr
0.817
-0.029
-3.44%
1 Jan 1999 Jahr
0.725
-0.092
-11.28%
1 Jan 2000 Jahr
0.803
+0.078
10.76%
1 Jan 2001 Jahr
0.823
+0.02
2.45%
1 Jan 2002 Jahr
0.888
+0.065
7.92%
1 Jan 2003 Jahr
0.837
-0.051
-5.71%
1 Jan 2004 Jahr
0.893
+0.056
6.7%
1 Jan 2005 Jahr
0.947
+0.054
6.06%
1 Jan 2006 Jahr
0.978
+0.03
3.19%
1 Jan 2007 Jahr
0.986
+0.008
0.85%
1 Jan 2008 Jahr
0.966
-0.019
-1.97%
1 Jan 2009 Jahr
1.001
+0.034
3.56%
1 Jan 2010 Jahr
1.07
+0.069
6.92%
1 Jan 2011 Jahr
0.993
-0.077
-7.18%
1 Jan 2012 Jahr
0.811
-0.182
-18.3%
1 Jan 2013 Jahr
0.735
-0.076
-9.41%
1 Jan 2014 Jahr
0.993
+0.258
35.04%
Bewertung der Länder gemäß mit laufender Statistik nach Jahren


Kommentare: